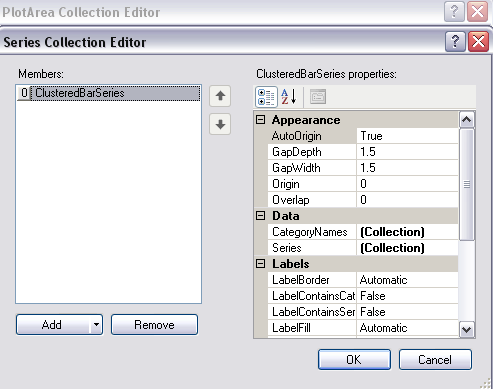
The Series Collection Editor can be used to set borders, bar shapes, and fill options, add chart data, specify labels and names, and other options. The editor appears as follows:

The Series Collection Editor is under the Data section after you select the Plot Areas Collection. You can also select a plot area from the diagram on the left side of the designer and then select the Series Collection under the Data section.
Return to the overview at Using the Chart Collection Editors.


