


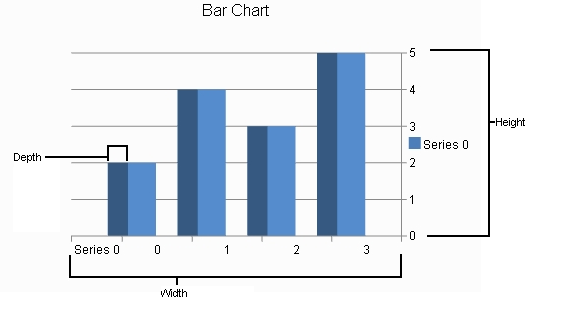
You can set the height, width, and depth for the plot area of the chart. The height of the chart is the distance from the top to the bottom of the plot area. The width of the chart is the distance from the right to the left of the plot area. The depth of the plot area is the distance from the back to the front of the chart.
In two dimensions, the height and width would be the rectangle that makes up the plot area. In three dimensions, the height, width, and depth would be the cube that makes up the plot area. The depth is the size of the cube along the z-axis. The following image shows a 3D chart.
See the following for more information:
Return to the overview at Understanding and Customizing Charts.
Using Code
Use properties in the plot area classes to set the size and depth.
Example
The following example sets the size for a plot area.
| C# |  Copy Code Copy Code |
|---|---|
PiePlotArea plotArea = new PiePlotArea(); plotArea.Location = new PointF(0.2f, 0.2f); plotArea.Size = new SizeF(0.6f, 0.6f); plotArea.Series.Add(series); |
|
| VB | Copy Code |
|---|---|
Dim plotArea As New FarPoint.Web.Chart.PiePlotArea() plotArea.Location = New PointF(0.2F, 0.2F) plotArea.Size = New SizeF(0.6F, 0.6F) plotArea.Series.Add(series) |
|
Using the Chart Designer
- Select the PlotArea Collection editor.
- Set properties as needed.
- Select Apply and OK to close the Chart Designer.