


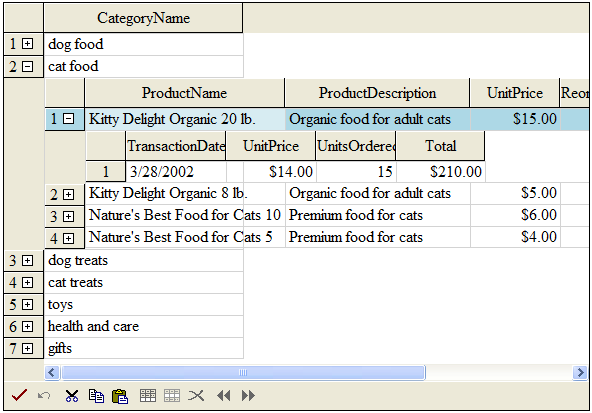
You can display relational data, such as from a relational database, on a sheet in hierarchies. The following figure shows an example of how you can display the data from the database provided for the tutorials.
To set up hierarchical data display, you first create a data set to hold the relational data, then define the relations between the data, and finally, set the component to display the data as you want. This is the procedure described in the examples that follow.
The hierarchical display of data, of displaying sheets within cells of a spread sheet, can fill up the visible part of the component quickly. In order to let you minimize the amount of hierarchical overhead, that is the amount of space taken by the higher levels of the hierarchy, you can collapse the hierarchy using the display of the hierarchy bar. For more information about the hierarchy bar, refer to Customizing the Hierarchy Bar.
For more information on Outlook-style grouping for a hierarchical display of data, refer to Customizing Grouping of Rows of User Data.
Properties such as EditModePermanent and EditModeReplace only apply to the parent Spread and do not apply to the child sheets unless you set them in the ChildViewCreated event.
Sample projects that demonstrate hierarchical data binding can be found in the samples folder. GroupWareCS is a C# sample project.
Return to the overview Managing Data Binding.
Using a Shortcut
- Create your data set.
- Set up the data relations between the data coming from the data set, for example, between tables coming from a relational database.
- Set the FpSpread component’s or Sheet’s DataSource property equal to the data set.
- Provide code in the FpSpread component’s ChildViewCreated event for displaying the parent and child views of the data.
Example
This example binds the component to a data set that contains multiple related tables from a database and sets up the component to display the data in hierarchies. This example uses the database provided for the tutorials (databind.mdb). If you performed the default installation, the database file is in \Program Files\GrapeCity\Spread.NET 6\ASP.NET\v6.x\Samples\Files. This assumes that before this code you have an include statement:
| Visual Basic |  Copy Code Copy Code |
|---|---|
Imports System.Data.OleDb
|
|
And here is the code:
| Visual Basic | Copy Code |
|---|---|
Private Sub Form1_Load(ByVal sender As System.Object, ByVal e As System.EventArgs) Handles MyBase.Load If IsPostBack Then Return ' Call subroutines to set up data and format the Spread component InitData() FormatSpread() End Sub Private Sub Form1_Load(ByVal sender As System.Object, ByVal e As System.EventArgs) Handles MyBase.Load ' Call subroutines to set up data and format the Spread component InitData() FormatSpread() End Sub Private Sub InitData() Dim con As New OleDbConnection() Dim cmd As New OleDbCommand() Dim da As New OleDbDataAdapter() Dim ds As New DataSet() Dim dt As DataTable con.ConnectionString = "Provider=Microsoft.Jet.OLEDB.4.0; Data Source=C:\\Program Files\GrapeCity\Spread.WebForms\Samples\Files\databind.mdb" con.Open() With cmd .Connection = con .CommandType = CommandType.TableDirect .CommandText = "Categories" End With da.SelectCommand = cmd da.Fill(ds, "Categories") cmd.CommandText = "Products" da.SelectCommand = cmd da.Fill(ds, "Products") cmd.CommandText = "Inventory Transactions" da.SelectCommand = cmd da.Fill(ds, "Inventory Transactions") ds.Relations.Add("Root", ds.Tables("Categories").Columns("CategoryID"), ds.Tables("Products").Columns("CategoryID")) ds.Relations.Add("Secondary", ds.Tables("Products").Columns("ProductID"), ds.Tables("Inventory Transactions").Columns("TransactionID")) FpSpread1.DataSource = ds End Sub Private Sub FormatSpread() With FpSpread1.Sheets(0) .ColumnHeader.Rows(0).Height = 30 .Columns(0).Visible = False .Columns(0).Width = 200 End With End Sub Private Sub FpSpread1_ChildViewCreated(ByVal sender As Object, ByVal e As FarPoint.Web.Spread.ChildViewCreatedEventArgs) Handles FpSpread1.ChildViewCreated Dim dateType As New FarPoint.Web.Spread.DateTimeCellType() If e.SheetView.RelationName = "Root" Then With e.SheetView .DataAutoCellTypes = False .ColumnHeader.Rows(0).Height = 30 .Columns(0).Visible = False .Columns(3).Visible = False .Columns(4).Visible = False .Columns(1).Width = 200 .Columns(2).Width = 185 .Columns(6).Width = 85 .Columns(7).Width = 80 .Columns(8).Width = 80 .Columns(5).CellType = New FarPoint.Web.Spread.CurrencyCellType() .Columns(7.CellType) = New FarPoint.Web.Spread.CheckBoxCellType() End With Else With e.SheetView .DataAutoCellTypes = False .DataAutoSizeColumns = False .ColumnHeader.Rows(0).Height = 30 .Columns(0).Visible = False .Columns(2).Visible = False .Columns(3).Visible = False .Columns(4).Visible = False .Columns(7).Visible = False .Columns(8).Visible = False .Columns(9).Visible = False .Columns(1).Width = 100 .Columns(6).Width = 80 .Columns(5).CellType = New FarPoint.Web.Spread.CurrencyCellType() .Columns(1).CellType = dateType 'Add a total column .ColumnCount = .ColumnCount + 1 .ColumnHeader.Cells(0, .ColumnCount - 1).Value = "Total" .Columns(.ColumnCount - 1).CellType = New FarPoint.Web.Spread.CellType.CurrencyCellType() .Columns(.ColumnCount - 1).Formula = "F1*G1" End With End If |
|