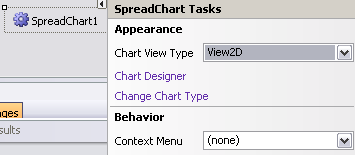
You can add a chart with the chart designer.
Using the Chart Designer
- Use the Edit Charts verb to add a chart control (or use the Insert menu in the Spread Designer). This creates a Spread Chart object on the form.

- Click the smart tag or verb of the Spread Chart object.
- Select the Chart Designer.

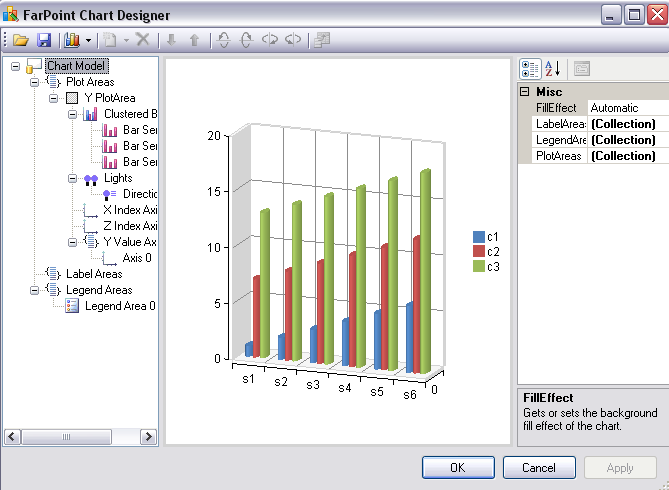
- The Chart Designer allows you to create a chart and set additional options. Use the PlotAreas Collection to create plots, series, and add data. Use the LegendAreas Collection to create a legend for the chart. Use the LabelAreas Collection to create labels for the chart.
- Click Apply to save the changes.