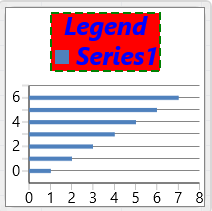
The legend is a separate area used to display labels of all the data series in one chart. You can set the font, background color, foreground color, and border for the legend.
Using Code
The following code creates a chart.
-
Add values to the control.
-
Create a Legend object and set the properties of the Legend class.
-
Create a chart using the SpreadChart class.
-
Add the chart.
| CS |
Copy Code |
|---|---|
| private double strokeThickness; private Brush stroke; private Brush fillBrush; private double chartFontSize; private double axisFontSize; private FontFamily fontFamily; private Brush foreground; strokeThickness = 2; stroke = new SolidColorBrush(Windows.UI.Colors.Green); fillBrush = new SolidColorBrush(Windows.UI.Colors.Red); foreground = new SolidColorBrush(Windows.UI.Colors.Blue); chartFontSize = 25; axisFontSize = 25; fontFamily = new FontFamily("Arial Narrow"); GrapeCity.Xaml.SpreadSheet.Data.SpreadChart chart = new GrapeCity.Xaml.SpreadSheet.Data.SpreadChart("Chart", GrapeCity.Xaml.SpreadSheet.Data.SpreadChartType.BarStacked, "Sheet1!$A$1:$A$7", 0, 0, 200, 200); gcSpreadSheet1.ActiveSheet.SetArray(0, 0, new object[,] { { 1 }, { 2 }, { 3 }, { 4 }, { 5 }, { 6 }, { 7 }, { 8 }, { 9 }, { 10 } }); GrapeCity.Xaml.SpreadSheet.Data.Legend chartLegend = new GrapeCity.Xaml.SpreadSheet.Data.Legend(); chartLegend.Fill = fillBrush; chartLegend.FontSize = chartFontSize; chartLegend.FontFamily = fontFamily; chartLegend.FontStretch = Windows.UI.Text.FontStretch.ExtraExpanded; chartLegend.FontStyle = Windows.UI.Text.FontStyle.Italic; chartLegend.FontWeight = Windows.UI.Text.FontWeights.Bold; chartLegend.Foreground = foreground; chartLegend.Stroke = stroke; chartLegend.StrokeThickness = strokeThickness; chartLegend.Orientation = Orientation.Vertical; chartLegend.Alignment = GrapeCity.Xaml.SpreadSheet.Data.LegendAlignment.TopCenter; chartLegend.Text = "Legend"; chartLegend.StrokeDashType = GrapeCity.Xaml.SpreadSheet.Data.StrokeDashType.Dash; chart.Legend = chartLegend; gcSpreadSheet1.ActiveSheet.Charts.Add(chart); | |
| VB |
Copy Code |
|---|---|
| Private strokeThickness As Double Private stroke As Brush Private fillBrush As Brush Private chartFontSize As Double Private axisFontSize As Double Private fontFamily As FontFamily Private foreground As Brush strokeThickness = 2 stroke = New SolidColorBrush(Windows.UI.Colors.Green) fillBrush = New SolidColorBrush(Windows.UI.Colors.Red) foreground = New SolidColorBrush(Windows.UI.Colors.Blue) chartFontSize = 25 axisFontSize = 25 fontFamily = New FontFamily("Arial Narrow") Dim chart As New GrapeCity.Xaml.SpreadSheet.Data.SpreadChart("Chart", GrapeCity.Xaml.SpreadSheet.Data.SpreadChartType.BarStacked, "Sheet1!$A$1:$A$7", 0, 0, 200, 200) GcSpreadSheet1.ActiveSheet.SetArray(0, 0, New Object(,) {{1}, {2}, {3}, {4}, {5}, {6}, {7}, {8}, {9}, {10}}) Dim chartLegend As New GrapeCity.Xaml.SpreadSheet.Data.Legend() chartLegend.Fill = fillBrush chartLegend.FontSize = chartFontSize chartLegend.FontFamily = fontFamily chartLegend.FontStretch = Windows.UI.Text.FontStretch.ExtraExpanded chartLegend.FontStyle = Windows.UI.Text.FontStyle.Italic chartLegend.FontWeight = Windows.UI.Text.FontWeights.Bold chartLegend.Foreground = foreground chartLegend.Stroke = stroke chartLegend.StrokeThickness = strokeThickness chartLegend.Orientation = Orientation.Vertical chartLegend.Alignment = GrapeCity.Xaml.SpreadSheet.Data.LegendAlignment.TopCenter chartLegend.Text = "Legend" chartLegend.StrokeDashType = GrapeCity.Xaml.SpreadSheet.Data.StrokeDashType.Dash chart.Legend = chartLegend GcSpreadSheet1.ActiveSheet.Charts.Add(chart) | |
See Also