You can display the horizontal axis with the DisplayXAxis property.
You can specify different minimum and maximum value options for the vertical axis with the SparklineAxisMinMax enumeration.
Using Code
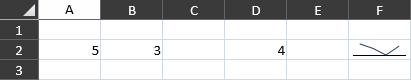
This example displays the x-axis.
| CS |
Copy Code |
|---|---|
GrapeCity.Xaml.SpreadSheet.Data.CellRange cellr2 = new GrapeCity.Xaml.SpreadSheet.Data.CellRange(1, 0, 1, 4); GrapeCity.Xaml.SpreadSheet.Data.SparklineSetting ex = new GrapeCity.Xaml.SpreadSheet.Data.SparklineSetting(); ex.DisplayEmptyCellsAs = GrapeCity.Xaml.SpreadSheet.Data.EmptyValueStyle.Zero; ex.DisplayXAxis = true; gcSpreadSheet1.Sheets[0].Cells[1, 0].Value = 5; gcSpreadSheet1.Sheets[0].Cells[1, 1].Value = 3; gcSpreadSheet1.Sheets[0].Cells[1, 3].Value = 4; gcSpreadSheet1.Sheets[0].SetSparkline(1, 5, cellr2, GrapeCity.Xaml.SpreadSheet.Data.DataOrientation.Horizontal, GrapeCity.Xaml.SpreadSheet.Data.SparklineType.Line, ex); | |
| VB |
Copy Code |
|---|---|
Dim cellr2 As New GrapeCity.Xaml.SpreadSheet.Data.CellRange(1, 0, 1, 4) Dim ex As New GrapeCity.Xaml.SpreadSheet.Data.SparklineSetting() ex.DisplayEmptyCellsAs = GrapeCity.Xaml.SpreadSheet.Data.EmptyValueStyle.Zero ex.DisplayXAxis = True GcSpreadSheet1.Sheets(0).Cells(1, 0).Value = 5 GcSpreadSheet1.Sheets(0).Cells(1, 1).Value = 3 GcSpreadSheet1.Sheets(0).Cells(1, 3).Value = 4 GcSpreadSheet1.Sheets(0).SetSparkline(1, 5, cellr2, GrapeCity.Xaml.SpreadSheet.Data.DataOrientation.Horizontal, GrapeCity.Xaml.SpreadSheet.Data.SparklineType.Line, ex) | |
See Also