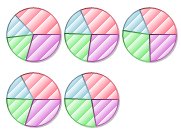
You can show repetitive light patterns in a chart element by setting the Scale property to a value less than 1. As you decrease the Scale, the light pattern repeats more. The values of the Scale property range from 0 to 1.
To create a light pattern for the Chart Data Series, complete the following steps:
1. Open the Visual Effects Designer. For details on how to access the Visual Effects designer see Access the Visual Effects Designer.
2. In the Available Elements list box, click on the box next to Default. The default visual effects settings for the data series appear on the Chart2D control.
3. Click on the Parameters tab. Set the light Shape property to Rectangle.
4. Select the Scale property and move the Scale slider to 0.20 or enter 0.20 in the text box.
Note: The Scale property is only applicable for the Rectangle light gradient.
The rectangular pattern is repeated for the data series in the Pie chart.

Send comments about this topic to ComponentOne. Copyright © ComponentOne LLC. All rights reserved. |