To add chart labels to the data series using the Edit labels editor, complete the following steps:
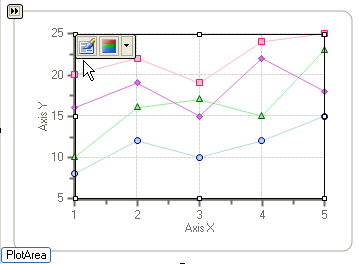
1. Slide your cursor inside the plot area to expose the PlotArea toolbar.

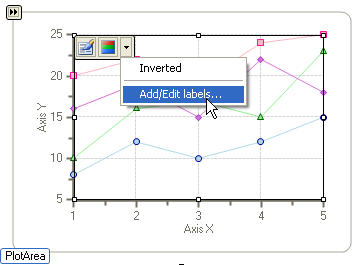
2. Select the drop-down button and choose Add/Edit labels.

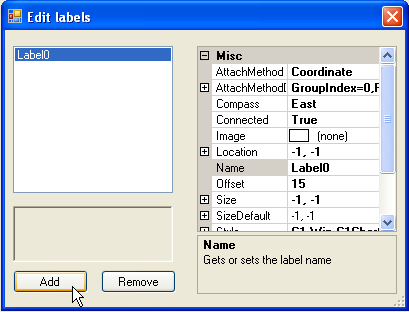
3. Select the Add button in the Edit labels editor to add a new label. Repeat this to add more labels. If you would like to remove a label, select the label you would like to remove and click on the Remove button.

4. Select the Close button to close the Edit labels editor.
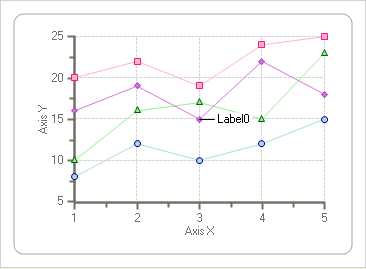
The Label0 appears on the coordinate.

Send comments about this topic to ComponentOne. Copyright © ComponentOne LLC. All rights reserved. |