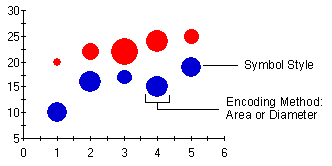
A Bubble chart combines two independent values to supply both the point y value and the point sizes. Bubble charts are used to represent an additional data value at each point by changing its size. The Y array elements determine the Cartesian position (as in a XY-Plot chart), and the Y1 element values determine the size of the bubble at each point. The size of the points can be encoded according to area or diameter. Using the LineStyle and SymbolStyle properties, the symbol style and color, and the appearance of connecting lines appear can be specified. For more information, see Line and Symbol Styles for the Series.
To set the chart type to Bubble at design time
· Expand the ChartGroups node in the Properties window. Open the ChartGroups Collection Editor by clicking the ellipsis button. In the right pane of the editor, set the ChartType property to Bubble.
· An alternate method to change chart type is to right-click the existing chart and select Chart Properties. From the Gallery, select ChartType as XY-Plot and Chart sub-type as Bubble.
· Another alternate method is to select Chart Properties from the Properties pane. From the Gallery, select ChartType as XY-Plot and Chart sub-type as Bubble.
 Bubble Chart Programming Considerations
Send comments about this topic to ComponentOne. Copyright © ComponentOne LLC. All rights reserved. |