Candle, HiLo, HiLoOpenClose charts are all types of Stock charts used in financial applications to show the opening, closing, high and low prices of a given stock.
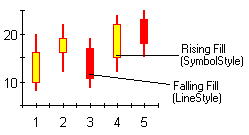
A Candle chart is a special type of HiLoOpenClose chart. The candle (the solid bar between the opening and closing values) represents the change in stock price from opening to closing. With Simple Candle charts, a hollow candle indicates a rising stock price (close was higher than open), and a filled candle indicates a falling stock price (open was higher than close). With Complex Candle charts, the SymbolStyle color represents a rising stock price, and the LineStyle represents a falling stock price.
Using the LineStyle and SymbolStyle properties and the HiLoData class, the fill and line properties of each series can be customized. For more information, see Line and Symbol Styles for the Series.
To set the chart type to Candle at design time
· Expand the ChartGroups node in the Properties window. Open the ChartGroups Collection Editor by clicking the ellipsis button. In the right pane of the editor, set the ChartType property to Candle.
· An alternate method to change chart type is to right-click the existing chart and select Chart Properties. From the Gallery, select ChartType as Stock and Chart sub-type as Candle.
· Another alternate method is to select Chart Properties from the Properties pane. From the Gallery, select ChartType as Stock and Chart sub-type as Candle.
 Candle Chart Programming Considerations
Send comments about this topic to ComponentOne. Copyright © ComponentOne LLC. All rights reserved. |