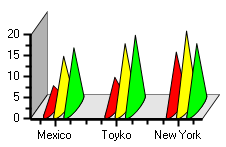
A Cone chart is a variation of the 3D Bar and Column charts. It represents the bars or columns as cones. The cone chart essentially is a rotated triangle. It has a flat circular base and one curved side topped by a higher point.
To set the bar chart to Cone at design time
· Expand the ChartGroups node in the Properties window. Open the ChartGroups Collection Editor by clicking the ellipsis button. In the right pane of the editor, set the ChartType property to Cone.
· An alternate method to change chart type is to right-click the existing chart and select Chart Properties. From the Gallery, select Cone.
· Another alternate method is to select Cone, from the C1Chart toolbar.
Send comments about this topic to ComponentOne. Copyright © ComponentOne LLC. All rights reserved. |