To define custom point style condition the user must set Selection property of PointStyle to PointStyleSelectionEnum.Custom and provide event handler for the Select event. The following code creates a custom point style:
Private Sub Button1_Click(ByVal sender
As System.Object, ByVal e As System.EventArgs)_
Handles
Button1.Click
' create point style
Dim ps As C1.Win.C1Chart.PointStyle = New C1.Win.C1Chart.PointStyle()
' custom point style
ps.Selection = C1.Win.C1Chart.PointStyleSelectionEnum.Custom
AddHandler ps.Select, AddressOf PS_Select
' add point style
c1Chart1.ChartGroups(0).ChartData.PointStylesList.Add(ps)
End Sub
Private Sub PS_Select(ByVal sender As
Object, ByVal e As _
C1.Win.C1Chart.PointStyleSelectEventArgs)
Dim ps As C1.Win.C1Chart.PointStyle = CType(sender, C1.Win.C1Chart.PointStyle)
' set visual appearance depending on y value
Dim ds As
C1.Win.C1Chart.ChartDataSeries = _
c1Chart1.ChartGroups(0).ChartData(e.SeriesIndex)
Dim y As Double = Convert.ToDouble(ds.Y(e.PointIndex))
If (y < 0) Then
ps.LineStyle.Color = Color.Blue
Else
ps.LineStyle.Color = Color.Red
End If
' apply to all points
e.Selected = True
End Sub
· C#
private void button1_Click(object sender, System.EventArgs e)
{
// create point style
C1.Win.C1Chart.PointStyle ps = new C1.Win.C1Chart.PointStyle();
// custom point style
ps.Selection = C1.Win.C1Chart.PointStyleSelectionEnum.Custom;
ps.Select += new C1.Win.C1Chart.PointStyleSelectEventHandler(PS_Select);
// add point style
c1Chart1.ChartGroups[0].ChartData.PointStylesList.Add( ps);
}
void PS_Select( object sender, C1.Win.C1Chart.PointStyleSelectEventArgs e)
{
C1.Win.C1Chart.PointStyle ps = sender as C1.Win.C1Chart.PointStyle;
// set visual appearance depending on y value
C1.Win.C1Chart.ChartDataSeries ds = c1Chart1.ChartGroups[0].ChartData[e.SeriesIndex];
double y = Convert.ToDouble( ds.Y[e.PointIndex]);
if( y<0)
ps.LineStyle.Color = Color.Blue;
else
ps.LineStyle.Color = Color.Red;
// apply to all points
e.Selected = true;
}
· Delphi
procedure TWinForm1.PS_Select(sender: System.Object;
e: C1.Win.C1Chart.PointStyleSelectEventArgs);
var
ps: C1.Win.C1Chart.PointStyle;
ds: C1.Win.C1Chart.ChartDataSeries;
y: double;
begin
// set visual appearance depending on y value
ps := C1.Win.C1Chart.PointStyle(sender);
ds := C1Chart1.ChartGroups[0].ChartData[e.SeriesIndex];
y := Convert.ToDouble( ds.Y[e.PointIndex]);
if y < 0 then
ps.LineStyle.Color := Color.Blue
else
ps.LineStyle.Color := Color.Red;
// apply to all points
e.Selected := true;
end;
procedure TWinForm1.Button2_Click(sender: System.Object; e: System.EventArgs);
var
ps: C1.Win.C1Chart.PointStyle;
begin
// create point style
ps := C1.Win.C1Chart.PointStyle.Create;
// custom point style
ps.Selection := C1.Win.C1Chart.PointStyleSelectionEnum.Custom;
Include(ps.Select, Self.PS_Select);
// add point style
c1Chart1.ChartGroups[0].ChartData.PointStylesList.Add( ps);
end;
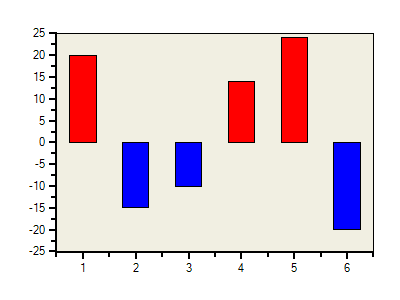
A custom blue point style is created for Y values less than zero and a custom red point style is created for y values greater than zero.
Send comments about this topic to ComponentOne. Copyright © ComponentOne LLC. All rights reserved. |