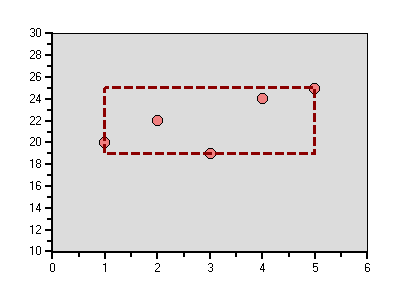
To implement a custom trendline a class implementing ICustomTrendLine interface must be created. The instance of this class is assigned toCustomTrendLine property of a TrendLine object. In this case all points of trendline must be fully defined by the class and TrendLineType property setting is not relevant. The following sample code implements a custom TrendLine that corresponds to data limits.
Private Sub Button1_Click(ByVal sender
As System.Object, ByVal e As System.EventArgs) _
Handles
Button1.Click
' create trend line
Dim tl As
C1.Win.C1Chart.TrendLine = _
c1Chart1.ChartGroups(0).ChartData.TrendsList.AddNewTrendLine()
' setup line properties
tl.LineStyle.Thickness = 3
tl.LineStyle.Pattern = C1.Win.C1Chart.LinePatternEnum.Dash
' set custom trend line
tl.CustomTrendLine = New CustomTrendLine()
End Sub
Public Class
CustomTrendLine_
Implements C1.Win.C1Chart.ICustomTrendLine
Private _x() As Double
Private _y() As Double
Public Sub Calculate(ByVal tl
As C1.Win.C1Chart.TrendLine, ByVal x() As Double, _
ByVal y() As
Double)Implements C1.Win.C1Chart.ICustomTrendLine.Calculate
If x Is Nothing Or x.Length = 0 Or y Is Nothing Or y.Length = 0 Then
_x = Nothing
_y = Nothing
Return
End If
' find min and max
Dim xmin As Double = x(0), xmax = x(0)
Dim ymin As Double = y(0), ymax = y(0)
Dim i As Integer
For i = 1 To x.Length - 1
If x(i) < xmin Then
xmin = x(i)
ElseIf x(i) > xmax Then
xmax = x(i)
End If
If y(i) < ymin Then
ymin = y(i)
ElseIf y(i) > ymax Then
ymax = y(i)
End If
Next
' rectangle around data points
_x = New Double(4) {}
_y = New Double(4) {}
_x(0) = xmin
_y(0) = ymin
_x(4) = _x(0)
_y(4) = _y(0)
_x(2) = xmax
_y(2) = ymax
_x(1) = _x(0)
_y(1) = _y(2)
_x(3) = _x(2)
_y(3) = _y(0)
End Sub
Public Function GetXValues() As
Double() _
Implements
C1.Win.C1Chart.ICustomTrendLine.GetXValues
Return _x
End Function
Public Function GetYValues() As
Double() _
Implements
C1.Win.C1Chart.ICustomTrendLine.GetYValues
Return _y
End Function
' don't use it just return something
Public Function GetY(ByVal x As
Double) As Double _
Implements
C1.Win.C1Chart.ICustomTrendLine.GetY
Return 0
End Function
Public ReadOnly Property Text()
As String _
Implements C1.Win.C1Chart.ICustomTrendLine.Text
Get
Return "Custom trend"
End Get
End Property
End Class
· C#
private void button1_Click(object sender, System.EventArgs e)
{
// create trend line
C1.Win.C1Chart.TrendLine tl = c1Chart1.ChartGroups[0].ChartData.TrendsList.AddNewTrendLine();
// setup line properties
tl.LineStyle.Color = Color.DarkRed;
tl.LineStyle.Thickness = 3;
tl.LineStyle.Pattern = C1.Win.C1Chart.LinePatternEnum.Dash;
// set custom trend line
tl.CustomTrendLine = new CustomTrendLine();
}
public class CustomTrendLine : C1.Win.C1Chart.ICustomTrendLine
{
private double[] _x;
private double[] _y;
public void Calculate( C1.Win.C1Chart.TrendLine tl, double[] x, double [] y)
{
if( x==null || x.Length==0 || y==null || y.Length==0)
{
_x = null; _y = null;
return;
}
// find min and max
double xmin = x[0], xmax = x[0];
double ymin = y[0], ymax = y[0];
for( int i=1; i<x.Length; i++)
{
if( x[i] < xmin)
xmin = x[i];
else if( x[i] > xmax)
xmax = x[i];
if( y[i] < ymin)
ymin = y[i];
else if( y[i] > ymax)
ymax = y[i];
}
// rectangle around data points
_x = new double[5];
_y = new double[5];
_x[0] = xmin; _y[0] = ymin;
_x[4] = _x[0]; _y[4] = _y[0];
_x[2] = xmax; _y[2] = ymax;
_x[1] = _x[0]; _y[1] = _y[2];
_x[3] = _x[2]; _y[3] = _y[0];
}
public double[] GetXValues() { return _x;}
public double[] GetYValues() { return _y;}
// don't use it just return something
public double GetY( double x) { return 0;}
public string Text { get{ return "Custom trend";}}
}
· Delphi
type
TDoubleArray = array of Double;
CustomTrendLine = class(C1.Win.C1Chart.ICustomTrendLine)
strict private
_x: array of System.Double;
_y: array of System.Double;
public
function get_Text: string;
property Text: string read get_Text;
procedure Calculate(tl: C1.Win.C1Chart.TrendLine; x: TDoubleArray;
y: TDoubleArray);
function GetXValues: TDoubleArray;
function GetYValues: TDoubleArray;
function GetY(x: Double): Double;
end;
implementation
function CustomTrendLine.get_Text: string;
begin
Result := 'Custom trend';
end;
procedure
CustomTrendLine.Calculate(tl: C1.Win.C1Chart.TrendLine;
x:
TDoubleArray; y: TDoubleArray);
var
i: Integer;
ymax: Double;
ymin: Double;
xmax: Double;
xmin: Double;
begin
if ((Length(x) = 0) or Length(y) = 0) then
begin
Self._x := nil;
Self._y := nil;
Exit;
end;
xmin := x[0];
xmax := x[0];
ymin := y[0];
ymax := y[0];
i := 1;
while (i < Length(x)) do
begin
if (x[i] < Self.xmin) then
Self.xmin := x[i]
else
if (x[i] > xmax) then
xmax := x[i];
if (y[i] < Self.ymin) then
Self.ymin := y[i]
else
if (y[i] > ymax) then
ymax := y[i];
end;
SetLength(_x, 5);
SetLength(_y, 5);
Self._x[0] := Self.xmin;
Self._y[0] := Self.ymin;
Self._x[4] := Self._x[0];
Self._y[4] := Self._y[0];
Self._x[2] := xmax;
Self._y[2] := ymax;
Self._x[1] := Self._x[0];
Self._y[1] := Self._y[2];
Self._x[3] := Self._x[2];
Self._y[3] := Self._y[0];
end;
function CustomTrendLine.GetXValues: TDoubleArray;
begin
Result := Self._x;
end;
function CustomTrendLine.GetYValues: TDoubleArray;
begin
Result := Self._y;
end;
function Class1.CustomTrendLine.GetY(x: Double): Double;
begin
Result := 0;
end;
procedure TForm1.Button1Click(sender: object; e: System.EventArgs);
var
tl: C1.Win.C1Chart.TrendLine;
begin
tl := c1Chart1.ChartGroups[0].ChartData.TrendsList.AddNewTrendLine;
tl.LineStyle.Color := Color.DarkRed;
tl.LineStyle.Thickness := 3;
tl.LineStyle.Pattern := C1.Win.C1Chart.LinePatternEnum.Dash;
tl.CustomTrendLine := CustomTrendLine.Create;
end;
This topic illustrates the following:
A custom red dashed trend line is created around the data points.
Send comments about this topic to ComponentOne. Copyright © ComponentOne LLC. All rights reserved. |