The following illustration shows the ChartGroups elements on C1Chart.
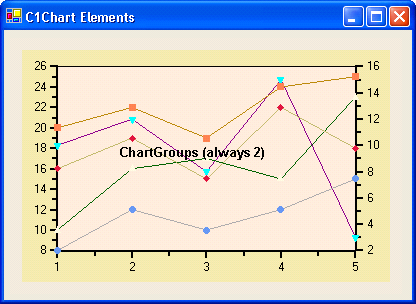
This property returns a collection of two ChartGroup objects (always Group0 and Group1, you can’t add or remove elements from this collection). These objects determine the chart type and contain the data being charted.
The first group (Group0) contains series that are charted against the primary Y-axis. The second group (Group1) may be empty or it may contain series that are charted against the secondary Y-axis.
Because there are two ChartGroup objects, and the chart type is associated with the ChartGroup, you can mix up to two chart types in the same chart. For example, you can create charts that show some series as bars and some as lines.
The ChartGroup objects have the following main properties:
|
Property |
Description |
|
Returns a ChartData object that contains a SeriesList property that holds the data for all series in the group. This property is described in the next topic. | |
|
Determines the type of chart to use when rendering this group (there are many chart types available, and you can select different types for each ChartGroup). | |
|
Determines whether graphical elements used to display the data (bars, areas, pie slices) should be outlined using the color specified by the ForeColor property. | |
|
Determines whether the data should be stacked (by adding Y values) when the series are rendered. |
 ChartData Object
Send comments about this topic to ComponentOne. Copyright © ComponentOne LLC. All rights reserved. |