A ComponentOne doughnut chart is a pie chart with a non-zero radius and is identical in function to a pie chart, but can be used to increase ascetic appeal, particularly when shown with 3D effects. As with all pie charts, each doughnut shows each series as a fraction of the whole at each data point. If multiple data points are specified, then multiple doughnuts appear in the chart.
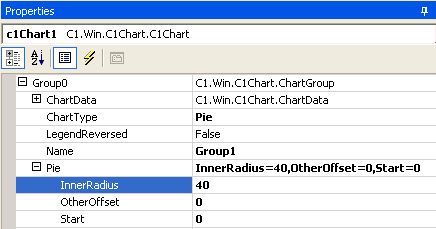
A doughnut chart can be created by setting the InnerRadius property of a pie chart to a non-zero value. The InnerRadius value represents the percentage of the full pie radius. The InnerRadius property can be accessed in the pie object of each Chart group. The chart property sheet below shows the InnerRadius property. In this example the InnerRadius property is set to 40 percent.
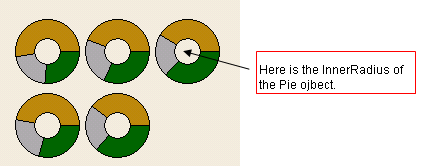
The picture below illustrates the effect on the pie charts by setting the InnerRadius property to 40 percent:
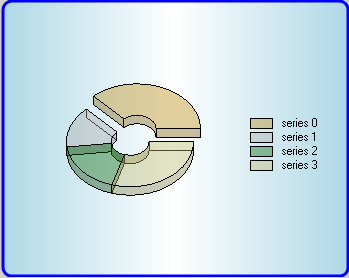
The following illustration is another example of a doughnut chart. In this example, the Offset property of the ChartDataSeries object is set to 30.
Send comments about this topic to ComponentOne. Copyright © ComponentOne LLC. All rights reserved. |