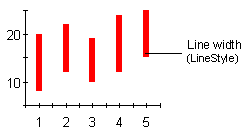
A HiLo chart combines two independent values to supply high and low data for each point in a series. HiLo charts are used primarily in financial applications to show the high and low price for a given stock. The elements of the Y and Y1 arrays in each series of a HiLo chart represent the "high" value, and the "low" value.
Using the LineStyle, the fill and line properties of each series can be customized. For more information, see Line and Symbol Styles for the Series.
To set the chart type to HiLo at design time
· Expand the ChartGroups node in the Properties window. Open the ChartGroups Collection Editor by clicking the ellipsis button. In the right pane of the editor, set the ChartType property to HiLo.
· An alternate method to change chart type is to right-click the existing chart and select Chart Properties. From the Gallery, select ChartType as Stock and Chart sub-type as Hi-low.
· Another alternate method is to select Chart Properties from the Properties pane. From the Gallery, select ChartType as Stock and Chart sub-type as Hi-low.
 HiLo Chart Programming Considerations
Send comments about this topic to ComponentOne. Copyright © ComponentOne LLC. All rights reserved. |