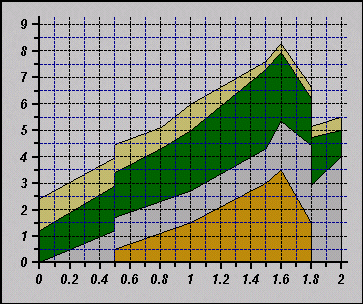
Problems arise with the stacked chart if the first series in the data set does not contain points that match up to the Min and the Max points of the other series. If the first series of the chart does not contain the amount of X values as successive series, then these series no longer have a definite starting point as in the image below. C1Chart deals with this irregularity in a logical manner. The data where the Y values for the first series do not exist are taken to be 0. Then each successive series is added onto this creating a discontinuity, best demonstrated by the Stacked Area chart below.
Send comments about this topic to ComponentOne. Copyright © ComponentOne LLC. All rights reserved. |