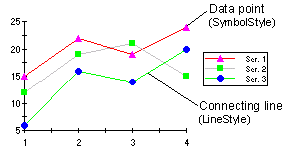
Line and XY-Plot charts draw each series as connected points of data. By customizing Line and Symbol Styles for each series, the connecting lines can be removed to emphasize the data values themselves, or the points can be removed to emphasize the relationship between points. The series can be drawn independently or stacked. The line and symbol properties for each series can also be customized. For more information, see Line and Symbol Styles for the Series.
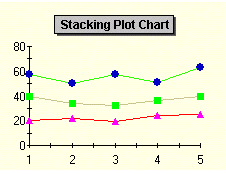
Use the ChartGroup object’s Stacked property to create a stacking Plot chart. Stacking charts represent the data by stacking the values for each series on top of the values from the previous series.
To set the chart type to Line or X-Y Plot at design time
· Expand the ChartGroups node in the Properties window. Open the ChartGroups Collection Editor by clicking the ellipsis button. In the right pane of the editor, set the ChartType property to XY-Plot. The Line Chart option is not available using this method.
· An alternate method to change chart type is to right-click the existing chart and select Chart Properties. From the Gallery, select Chart type as either Line or XY-Plot.
· Another alternate method is to select Chart Properties from the bottom of the Properties pane. From the Gallery, select Chart type as either Line or XY-Plot.
 Plot Chart Programming Considerations
Send comments about this topic to ComponentOne. Copyright © ComponentOne LLC. All rights reserved. |