A common way to display data series in a pie chart is through a legend, such as the previous example. This method works well because the information is laid out in a single region. Regardless of how many labels you have, they are laid out neatly within the legend.
In some cases, however, you may want to position the labels near the data points to make their association more obvious. You may also want to add labels containing information on data points or other chart elements, and position those labels at specific locations or near certain chart elements.
For this type of task, C1Chart provides the ChartLabels property, which allows you to create Label objects and attach them to any chart elements.
For example, the following picture shows the same pie chart as the previous example, this time with Labels attached to each slice instead of a Legend.
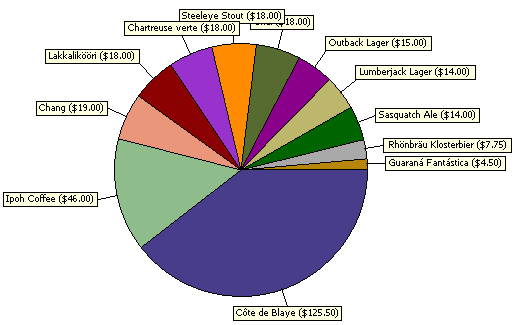
The chart illustrated a common difficulty associated with using too many chart labels: they may overlap and can be difficult to position correctly if there are too many of them (in this example the labels were automatically positioned by C1Chart).
The code used to create this second chart starts with the exact same steps used to create the first pie chart. The labels are created using the following additional code.
' hide legend, configure labels
C1Chart1.Legend.Visible = false
Dim s As Style = C1Chart1.ChartLabels.DefaultLabelStyle
s.Font = new Font("Tahoma", 7)
s.BackColor = SystemColors.Info
s.Opaque = true
s.Border.BorderStyle = BorderStyleEnum.Solid
' attach labels to each slice
Dim i As Integer
For i = 0 To data.Count – 1
Dim lbl As C1.Win.C1Chart.Label = _
C1Chart1.ChartLabels.LabelsCollection.AddNewLabel()
lbl.Text = string.Format("{0} ({1:c})", _
data(i)("ProductName"), data(i)("UnitPrice"))
lbl.Compass = LabelCompassEnum.Radial
lbl.Offset = 20
lbl.Connected = True
lbl.Visible = True
lbl.AttachMethod = AttachMethodEnum.DataIndex
Dim am As AttachMethodData = lbl.AttachMethodData
am.GroupIndex = 0
am.SeriesIndex = I
am.PointIndex = 0
Next i
· C#
// hide legend, configure labels
C1Chart1.Legend.Visible = false;
Style s = C1Chart1.ChartLabels.DefaultLabelStyle;
s.Font = new Font("Tahoma", 7);
s.BackColor = SystemColors.Info;
s.Opaque = true;
s.Border.BorderStyle = BorderStyleEnum.Solid;
// attach labels to each slice
for (int i = 0; i < data.Count; i++)
{
C1.Win.C1Chart.Label lbl = C1Chart1.ChartLabels.LabelsCollection.AddNewLabel();
lbl.Text = string.Format("{0} ({1:c})",
data[i]["ProductName"], data[i]["UnitPrice"]);
lbl.Compass = LabelCompassEnum.Radial;
lbl.Offset = 20;
lbl.Connected = true;
lbl.Visible = true;
lbl.AttachMethod = AttachMethodEnum.DataIndex;
AttachMethodData am = lbl.AttachMethodData;
am.GroupIndex = 0;
am.SeriesIndex = i;
am.PointIndex = 0;
}
· Delphi
var
s: Style;
i: Integer;
lbl: C1.Win.C1Chart.Label;
am: AttachMethodData;
begin
// hide legend, configure labels
C1Chart1.Legend.Visible := false;
s := C1Chart1.ChartLabels.DefaultLabelStyle;
s.Font := new Font('Tahoma', 7);
s.BackColor := SystemColors.Info;
s.Opaque := true;
s.Border.BorderStyle := BorderStyleEnum.Solid;
// attach labels to each slice
for i := 0 to data.Count – 1 do
begin
lbl := C1Chart1.ChartLabels.LabelsCollection.AddNewLabel();
lbl.Text := string.Format('{0} ({1:c})',
data[i]['ProductName'], data[i]['UnitPrice']);
lbl.Compass := LabelCompassEnum.Radial;
lbl.Offset := 20;
lbl.Connected := true;
lbl.Visible := true;
lbl.AttachMethod := AttachMethodEnum.DataIndex;
am := lbl.AttachMethodData;
am.GroupIndex := 0;
am.SeriesIndex := i;
am.PointIndex := 0;
end;
end;
Send comments about this topic to ComponentOne. Copyright © ComponentOne LLC. All rights reserved. |