The chart below demonstrates a Polar chart using symbols.
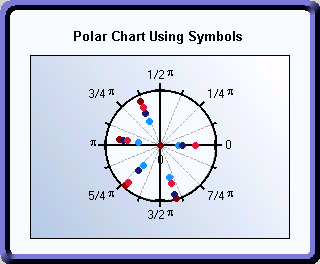
A Polar chart draws the x and y coordinates in each series as (theta,r), where theta is amount of rotation from the origin and r is the distance from the origin. theta may be specified in either degrees (default) or radians. Since the X-axis is a circle, the X-axis maximum and minimum values are fixed. To create a Polar chart with the use of symbols, set the following properties:
|
Controls the style of the chart. Set this property to Polar to create a standard line chart. | |
|
Determines the order in which the series entries of each ChartGroup appear in the legend. By setting this to False, the legend will be ordered by the default. If it is set to True, the order of the legend items will be reversed. In this sample, the LegendReversed property is set to False, however the Visible property is also set to False which means it will not be displayed at this time. | |
|
Determines whether figures drawn should be outlined in the PlotArea ForeColor. In this case, we set this property equal to True. | |
|
Determines whether the chart should stack the data. Set the Stacked property to False. | |
|
Determines whether 3D effects are used for charting the data in the ChartGroup. In this example, this property will be set to False. | |
|
Determines whether the ChartGroup is visible. Set this property to True so that the chart data will be displayed in the plot area of the chart. |
This example uses data between the values of 1 and 5, therefore the Degrees property should be set to false. This will cause the data to be displayed in radians. For more information, see Special Polar Chart Properties. Set the following Polar class properties:
|
Determines whether the X data and Start values reflect angles in degrees (True) or radians (False) for Polar charts. Set this property equal to False. | |
|
Determines whether polar charts measured in radians should be annotated with Pi rations. Set this property equal to True. | |
|
Determines the starting angle of Polar charts. This example has the starting angle set to 0. |
To add symbols to the data points on the polar chart, modify the ChartData’s SeriesList property. You can do this in code, or you can use the ChartDataSeries Collection Editor, see ChartDataSeries Collection Editor, for more information.
Send comments about this topic to ComponentOne. Copyright © ComponentOne LLC. All rights reserved. |