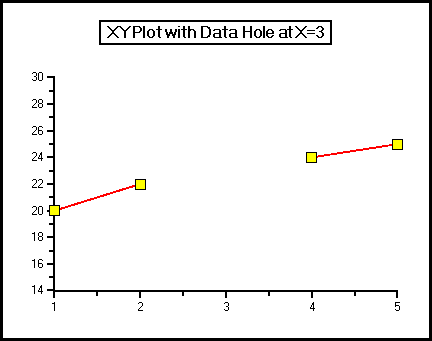
When gathered data is charted, it is sometimes necessary to visually provide an indication in the chart that data for a particular value is not available. For example, you can indicate that information is missing. A Data Hole is a break in data that are being charted, and is used in the chart to visually indicate that data is missing.
In C1Chart, holes are specified by setting the data point to be excluded to a specific, otherwise unused value in the data arrays. The Hole property of the ChartData object specifies the value to be used. For instance, assuming that the Hole value is set to –1000, and that data is unavailable for the third point of a series, a break or a hole can be introduced into the series plot by setting the Y value of the series point to –1000.
The default hole value is Single MaxValue or float MaxValue for Visual Basic and C#, respectively. Below is an example of a data hole in a X-Y Plot chart.

Send comments about this topic to ComponentOne. Copyright © ComponentOne LLC. All rights reserved. |
 Ignoring Data Holes