A Step chart is a form of a XY Plot chart. Step charts are often used when Y values change by discreet amounts, at specific values of X with a sudden change of value. A simple, everyday example would be a plot of a checkbook balance with time. As each deposit is made, and each check is written, the balance (Y value) of the check register changes suddenly, rather than gradually, as time passes (X value). During the time that no deposits are made, or checks written, the balance (Y value) remains constant as time passes.
Similar to Line and XY plots, the appearance of the step chart can be customized by using the Line and Symbol Styles for each series by changing colors, symbol size, and line thickness. Symbols can be removed entirely to emphasize the relationship between points or included to indicate actual data values. If data holes are present, the step chart behaves as expected, with series lines demonstrating known information up to the X value of the data hole. Symbols and lines resume once non-hole data is again encountered.
As with most XY style plots, step charts can be stacked when appropriate.
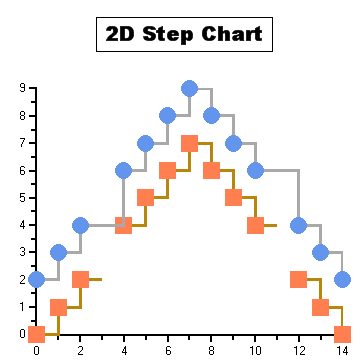
The following chart illustrates a 2D Step Chart:
To set the chart type to Step at design time
· Expand the ChartGroups node in the Properties window. Open the ChartGroups Collection Editor by clicking the ellipsis button. In the right pane of the editor, set the ChartType property to Step.
· An alternate method to change chart type is to right-click the existing chart and select Chart Properties. From the Gallery, select Chart type as Step.
· Another alternate method is to select Chart Properties from the Properties pane. From the Gallery, select Chart type as Step.
 Step Chart Programming Considerations
Send comments about this topic to ComponentOne. Copyright © ComponentOne LLC. All rights reserved. |