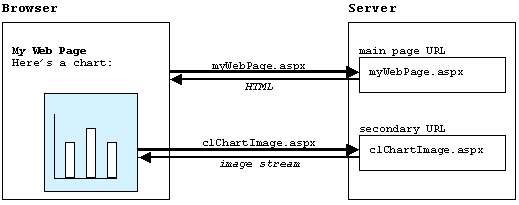
When you add a chart to a Web page, C1WebChart inserts an image in the HTML stream. This image is represented by an <img> tag and contains a reference to a second URL that provides the actual image. C1WebChart is responsible for creating this URL and providing its content. The following diagram illustrates this process:

The diagram shows a browser on the left, displaying an ASP page. To display this page, the browser requests the page content from the server (myWebPage.aspx) and receives an HTML stream. The HTML contains a chart, represented by an <img> tag. The source for this tag is a second URL (c1ChartImage.aspx) that the server translates into an image stream that is rendered in the browser.
The source attribute for the tag can be a temporary image file, an HttpHandler, or a second .aspx page. This is determined by the value of the ImageRenderMethod property. For more information on the ImageRenderMethod, see Using Different Methods for Rendering the Image Tag.
The source attribute also contains parameters that specify where the chart data is stored so the URL can create the chart image. This data can be stored in a temporary file, in the Session variable, or in the Cache. This is determined by the value of the ImageTransferMethod property.
By default, C1WebChart stores the chart data in the Session variable. In some cases, you may prefer to use the Cache or temporary files instead. Each option has its advantages and drawbacks, depending on how the server is set up and on the nature of the application. For details on the operation of the Session and Cache objects, please refer to the .NET documentation.
The ImageRenderMethod property has settings that range from completely automatic (HttpHandler, File) to manual (Manual). These settings are described in the topic, Using Different Methods for Rendering the Image Tag. For more information on applying the different ImageRenderMethod settings see, C1WebChart Tutorials.
The best combination for the ImageRenderMethod and ImageTransferMethod properties will depend on the complexity and variety of the charts being delivered, the expected site traffic, and server configuration. This is not a trivial task, but the good news is you can test different configurations easily, just by changing those two properties.
Send comments about this topic to ComponentOne. Copyright © ComponentOne LLC. All rights reserved. |
 Working with Two URLs