The ChartGroup Collection Editor allows the user to set or modify Group1 and Group2's properties. For more information on the ChartGroup, see Defining the ChartGroup Object.
To Access the ChartGroup Collection Editor
1. Right-click on the C1Chart control and select Properties from its context menu.
2. In the Properties window, expand the ChartGroups node, then click on the ellipsis button next to the ChartGroupCollection property. The ChartGroup Collection Editor appears.
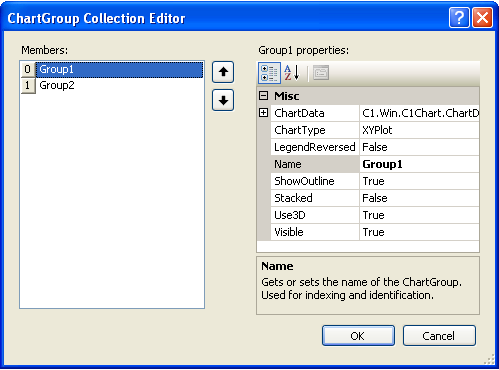
Properties available in the ChartGroup Collection
Editor ![]()
The following table includes the name and description of the properties available for the user in the ChartGroup Collection Editor at design time or they can be used in the ChartGroup class at run time:
|
Members |
Description |
|
ChartData |
Gets the number of data points in the series. |
|
ChartData.FunctionsList |
Returns the maximum X value of the series data. |
|
ChartData.HighLight |
Returns the maximum Y value of the series data. |
|
DataHighlight.Activation |
Returns the minimum X value of the series point data array. |
|
DataHighlight.Appearance |
Returns the minimum Y value of the series point data array. |
|
ChartDataSeries.PointData |
Gets the ChartDataArray object that manages point data (combined X and Y data). |
|
StatisticalData.PropertyGridEnabled |
Gets or sets whether statistic calculations are reported in property grids and by reflection. |
|
StatisticalData.DataStatus |
Gets a string indicating whether data is available for statistical calculations. |
|
ChartDataSeries.Tag |
Gets or sets the user data for the series. |
|
ChartDataArray.DataField |
The data field that is bound to. |
|
ChartDataArray.DataType |
Gets or sets the external datatype. |
|
ChartData.Hole |
Gets the data hole value. |
|
ChartDataSeries.Length |
Gets or sets the number of elements of the ChartDataArray. |
Send comments about this topic to ComponentOne. Copyright © ComponentOne LLC. All rights reserved. |