Cell Flooding Demo
This example demonstrates how to use the Cell property to format individual cells. The demo uses flooding to create a display combining numbers and bars.
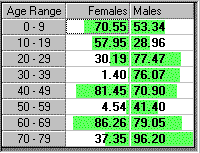
Here is how the final application will look:
This project is very simple. It consists of a single routine, the Form_Load event handler. Here is the code, followed by some comments:
Private Sub Form_Load()
Dim i As Long
Dim max As Double
' initialize array with random data
Dim count(1, 7) As Single
For i = 0 To 7
count(0, i) = Rnd * 100
count(1, i) = Rnd * 100
Next
' initialize control
fg.Cols = 3
fg.Rows = 9
fg.FloodColor = RGB(100, 255, 100)
fg.ColAlignment(0) = flexAlignCenterCenter
fg.ColAlignment(1) = flexAlignRightCenter
fg.ColAlignment(2) = flexAlignLeftCenter
fg.Cell(flexcpText, 0, 0) = "Age Range"
fg.Cell(flexcpText, 0, 1) = "Females"
fg.Cell(flexcpText, 0, 2) = "Males"
fg.ColFormat(-1) = "#.##"
' make data bold
fg.Cell(flexcpFontBold, 1, 1, _
fg.Rows - 1, fa.Cols - 1) = True
' place text in cells, keep track of maximum
For i = 0 To 7
fg.Cell(flexcpText, i + 1, 0) = _
10 * i & " - " & (10 * (i + 1) - 1)
fg.Cell(flexcpText, i + 1, 1) = count(0, i)
fg.Cell(flexcpText, i + 1, 2) = count(1, i)
If count(0, i) > max Then max = count(0, i)
If count(1, i) > max Then max = count(1, i)
Next
' set each cell's flood percentage,
' using max to scale from 0 to -100 for column 1
' and from 0 to 100 for column 2:
For i = 0 To 7
fg.Cell(flexcpFloodPercent, i + 1, 1) = _
-100 * count(0, i) / max
fg.Cell(flexcpFloodPercent, i + 1, 2) = _
100 * count(1, i) / max
Next
End Sub
The code starts by declaring and populating an array with random data. The data will be used later to populate the control.
Then the control is initialized. The code sets the number of rows and columns, column alignments, column titles, and the format that is to be used when displaying data. Note that when setting the ColFormat property, the -1 index is used as a wildcard so the setting is applied to all columns.
The Cell property is then used to set the font of the scrollable area to bold. It takes only a single statement, because the Cell property accepts a whole range as a parameter.
Next, the array containing the data is copied to the control (again using the Cell property). The code keeps track of the maximum value assigned to any cell in order to scale the flood percentages later.
Finally, the Cell property is used one last time to set the flood percentages. The percentages on the first column are set to negative values, which causes the bars to be drawn from right to left. The percentages on the second column are set to positive values, which causes the bars to be drawn from left to right.