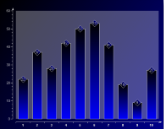
Use markers to show specific data series values in a chart. Markers are created by setting the Marker property of the series.
 |
The following code demonstrates how to create a marker object at run time and assign it to the Marker property of the Series object. The results are shown in the image above.
To write code in Visual Basic.NET
| Visual Basic code. Paste INSIDE the section Format event |
Copy Code
|
|---|---|
' create the marker object
Dim marker1 As New GrapeCity.ActiveReports.Chart.Marker

' set the marker properties.
marker1.Backdrop = New Chart.Graphics.Backdrop(Chart.Graphics.GradientType.Horizontal, Color.Navy, Color.Black)
marker1.Line = New Chart.Graphics.Line(Color.White)
marker1.Label = New Chart.LabelInfo(New Chart.Graphics.Line(Color.Transparent, 0, Chart.Graphics.LineStyle.None), New Chart.Graphics.Backdrop(Chart.Graphics.BackdropStyle.Transparent, Color.White, Color.White, _ Chart.Graphics.GradientType.Vertical,
System.Drawing.Drawing2D.HatchStyle.DottedGrid, Nothing, _Chart.Graphics.PicturePutStyle.Stretched), New Chart.FontInfo(Color.White, New Font("Arial", 8.0F)), "{Value}", Chart.Alignment.Center)
marker1.Size = 24
marker1.Style = Chart.MarkerStyle.Diamond

' assign the marker to the series Marker property
Me.ChartControl1.Series(0).Marker = marker1
|
|
To write code in C#
| C# code. Paste INSIDE the section Format event |
Copy Code
|
|---|---|
// create the marker object
GrapeCity.ActiveReports.Chart.Marker marker1 = new GrapeCity.ActiveReports.Chart.Marker();

// set the marker properties
marker1.Backdrop = new GrapeCity.ActiveReports.Chart.Graphics.Backdrop(GrapeCity.ActiveReports.Chart.Graphics.GradientType.Horizontal, System.Drawing.Color.Navy, System.Drawing.Color.Black);
marker1.Line = new GrapeCity.ActiveReports.Chart.Graphics.Line(System.Drawing.Color.White);
marker1.Label = new GrapeCity.ActiveReports.Chart.LabelInfo(new GrapeCity.ActiveReports.Chart.Graphics.Line(System.Drawing.Color.Transparent, 0, GrapeCity.ActiveReports.Chart.Graphics.LineStyle.None),
new GrapeCity.ActiveReports.Chart.Graphics.Backdrop(GrapeCity.ActiveReports.Chart.Graphics.BackdropStyle.Transparent, System.Drawing.Color.White, System.Drawing.Color.White, GrapeCity.ActiveReports.Chart.Graphics.GradientType.Vertical,
System.Drawing.Drawing2D.HatchStyle.DottedGrid, null, GrapeCity.ActiveReports.Chart.Graphics.PicturePutStyle.Stretched), new GrapeCity.ActiveReports.Chart.FontInfo(System.Drawing.Color.White, new System.Drawing.Font("Arial", 8F)), "{Value}",
GrapeCity.ActiveReports.Chart.Alignment.Center); marker1.Size = 24; marker1.Style = GrapeCity.ActiveReports.Chart.MarkerStyle.Diamond;

// assign the marker to the series Marker property
this.ChartControl1.Series[0].Marker = marker1;
|
|
See Also
 Show All
 Hide All