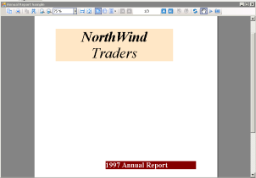
The AnnualReport sample demonstrates the use of SubReports, section report properties, and Chart control. It includes a StartupForm and AnnualReport, ProductSalesByCategory, Top10, Top10Customers, Top10Products reports.
 |
Sample Location
Visual Basic.NET
<User Folder>\ComponentOne Samples\ActiveReports 9\Section Reports\Layout\AnnualReport\VB.NET
C#
<User Folder>\ComponentOne Samples\ActiveReports 9\Section Reports\Layout\AnnualReport\C#
Runtime features
When you run this sample, a three page report appears wherein the first page mentions the name of the trader and year of the report, the second page displays company information along with a SubReport displaying category wise sales and the third page displays data in form of charts. The AnnualReport fetches data from ProductSalesByCategory report and Top10 report and displays it in the Viewer control. The Top10 report further fetches data from Top10Customers subreport and Top10Products subreport.
 |
Note: To run this sample, you must have access to the Nwind.mdb. A copy is located at [User Documents folder]\ComponentOne Samples\ActiveReports 9\Data\NWIND.mdb. If you are unable to access the data files in the sample, create the Data folder and place all the data files to this folder, or change the reference path to the data files within the folder according to your environment. |
Project Details
StartupForm
This form contains the ActiveReports Viewer control. The Dock property of the viewer is set to Fill so that it resizes automatically with the form at run time. Right-click and select View Code to see the code that displays the AnnualReport when the form loads.
AnnualReport report
This is the main report for the project.
ReportHeader section
This report features a two-page ReportHeader section that uses a PageBreak control to separate the two pages, and breaks to the second page by setting the ReportHeader section's NewPage property to After. This report shows how you can use the BackColor and ForeColor properties of labels to create a distinctive look for your reports.
The ReportHeader section also has a SubReport control that links to the ProductSalesByCategory report in the code behind the report, in the ReportStart event.
 |
Tip: It is recommended that you initialize reports in the ReportStart event rather than a section Format event so that a new report is not initialized every time the section runs. If the SubReport control is in a section that prints multiple times, you need to assign the report in the section Format event while still initializing in the ReportStart event. |
The yellow background in the right half of the ReportHeader section below the page break control is achieved by using the Shape control and setting its BackColor property. The image to the left is a Picture control.
Detail section
The Detail section contains one SubReport control that link in the code behind the report to the Top10 reports. In most reports, the Detail section would run multiple times. In this report, the Detail section has only labels, and no bound textboxes, so it will only run once. Therefore, the Top10 report can be assigned to the SubReport control in the ReportStart event where it is initialized.
Notice that the ReportFooter section has its Height property set to 0. This is because, except for the Detail section, all sections come in pairs. In order to use the ReportHeader section, you must also have a ReportFooter section. If you do not want to use it, you can set its Height to 0.
ProductSalesByCategory report
This is the report that is assigned to the SubReport control in the ReportHeader section of the Annual Report.
 |
Tip: This report has the ReportHeader/Footer and PageHeader/Footer sections removed. These sections are not printed within the SubReport control, so removing the sections saves processing time. |
Notice also that the PrintWidth property of this report is only 2.677 inches. This is so that it fits easily within the SubReport control on the Annual Report.
This report uses the GroupHeader section to display labels for the data fields that fill the Detail section. The fields in the Detail section repeat once for each row of data in the database.
Right-click in the grey area around the report and select View Code to see the code that sets the data source for the report. Notice that the background color of the Detail section is set to yellow on every second row of data.
Top10 report
Top10Customers and Top10Products reports
 Show All
 Hide All