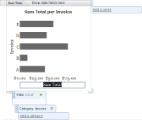
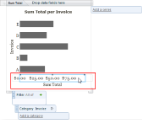
You can format the X and Y Axis labels by means of the Design Toolbar.
To format axis label text
- Double-click the label text area of the X or Y axis. The label area border is outlined and you can select and edit the text.

- On the Design toolbar, use the buttons in the Font and Text & Color sections to change the size, color, bold and italic settings, and alignment. For more information, see Design Tab.
- For the Y axis, if you do not want the label text to render horizontally above the Y axis, on the Chart Design Toolbar, in the Axis section, click the Vertical Title button.
 |
Note: You cannot change the font family of the label text. The font family is set on the Report Tab in the Themes section. |
To format axis scale labels
- Click in the scale label area of the X or Y axis. A border appears around the scale label area and markers appear along the axis.

- On the Chart Design Tools toolbar, in the Axis section, you can change to Angled Labels.
- On the Design toolbar, use the buttons in the Font and Text & Color sections to change the size, color, bold and italic settings, and alignment.
- For numeric values, you can also use the tools in the Format section to change the numeric formatting. For more information, see Design Tab.
To change the scale of numeric axis labels
- Click in the scale label area of a numeric axis. A border appears around the scale label area and markers appear along the axis.

- Above the toolbar, select the Chart Design Tools Tab. The Chart Design Tools toolbar appears, and as long as the numeric axis scale labels are selected, the Axis buttons are enabled.
- Use the buttons in the Axis section to change the minimum, maximum, and step values of the markings, and whether to use a logarithmic scale. For more information, see Chart Design Tools Tab.
See Also