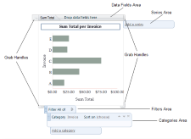
When you select a chart on the report design surface, adorners appear around the edges of the chart. The adorners allow you to control the data that is included in the chart and how it is displayed.
 |
Note: ActiveReports 8 Server displays a red X icon when you attempt a drag and drop activity that is not supported. |
 |
Each adorner allows you to control a specific type of data, and the grab handles allow you to resize or move the chart.
- Data Fields Area
- Displays data fields that serve as data points for the chart. You can drag attributes and drop them onto this area to add data points, or select an already-added data point and hit the Delete key on your keyboard to delete it.
- Filters Area
- Apply filters to your data to control how much of it is displayed. Use the drop-down arrow to select whether to display data with, with any of, with none of, with not all of, or none. Use the expansion arrows to open the filter area where you can drag and drop attributes to use for filtering. Once you have added an attribute by which to filter, you can select an operator to use for comparing it: equals, not equal to, greater than, greater than or equal to, less than, less than or equal to, or from... to. Based on your choice of operator, one or two text boxes appear to the right where you can enter a value or values against which to compare the filter attribute. To delete a filter, select it and press the Delete key on your keyboard.
- Categories Area
- Displays categories that serve as measures for the category axis. You can drag entities and attributes and drop them onto this area to add categories, or click the expansion arrows for an already-added category and click the Delete icon (a red X) to delete it. You can drag and drop the grab handle on the left of a category to reorganize multiple categories.
- Series Area
- Displays data set series that serve as chart points. You can drag entities and attributes and drop them onto this area to add a series, or click the expansion arrows for an already-added series and click the Delete icon (a red X) to delete it. You can drag and drop the grab handle on the left of a series to reorganize multiple series.
- Grab Handles
- The grab handles on each corner of the chart allow you to move, resize, or select it.
- The top left grab handle, sometimes called a thumb, allows you to move the chart using drag and drop, or click it to select the entire chart.
- The bottom right grab handle resizes both the height and width.
- The top right grab handle resizes the width.
- The bottom left grab handle resizes the height.
See Also