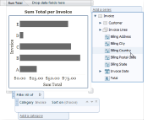
A series groups data dynamically, so you can optionally use them to add more dimensions to your data. For example, if you add a Billing Country series to an Invoice chart, instead of a single bar for each invoice, you have a single bar for each invoice in each country. The chart legend displays a different color or pattern for each country.
By default, a chart has no series grouping. You can add one or more series, change the order of multiple series groups, and delete series groups.
To add a new series
- Click the chart to reveal the adorners.
- To the right of the chart, click Add a series. A list of entities and attributes that you can use for a series drops down.

- Double-click an attribute or entity to add it as a Series. The new series is displayed along the same axis as the original data field in different colors or patterns. The colors or patterns are detailed in the legend.
 |
Note: Another way to add a series is to drag an attribute or entity from the Attribute Tree (or Entity Tree) and drop it onto the Series area. A red X icon appears when you drag it over an area where you cannot drop the item, and a bold blue line appears where the series will be added when you drag it over an area where you can drop it. Any attribute or entity that cannot be used as a series cannot be dropped and only displays a red X icon. |
To delete a series
A series is an additional dimension to the chart, so you can delete a series even if a chart has just one added series.
- Click the chart to reveal the adorners.
- Click the expansion arrow to the right of the series that you want to delete.
- In the expanded Series area that appears, click the Delete icon to the right. The series is removed.

To change the order of multiple series
If there is more than one series in the chart, you can change the order.
- Click the chart to reveal the adorners.
- Click the expansion arrow of the series that you want to move.
- To the right of the series name, up or down arrow buttons are enabled depending on whether there are additional series above or below the selected series. Click the up arrow to move the selected series above the preceding series, or click the down arrow to move it below the following series.

- Alternatively, you can click the grab handle to the left of the series that you want to move.
- The pointer changes to a four-way arrow, and you can drag the series up or down to the desired location. A red X icon appears when you drag it over a place where you cannot drop the series, and a bold blue line appears where the series will be inserted when you drag it over an area where you can drop it.
 Show All
 Hide All