An Area chart draws each series as connected points of data, filled below the points. Each series is drawn on top of the preceding series. The series can be drawn independently or stacked. Chart for Windows Phone supports the following types of Area charts:
•AreaSmoothed
•AreaStacked
•AreaStacked100pc
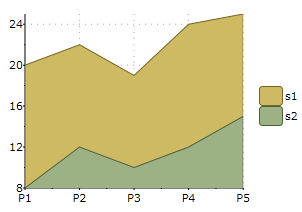
Area
The following image represents the Area chart when you set the ChartType property to Area:
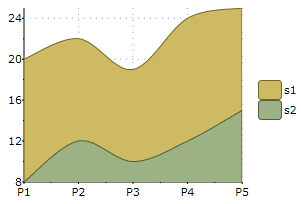
Area Smoothed
The following image represents the Area Smoothed chart when you set the ChartType property to AreaSmoothed:
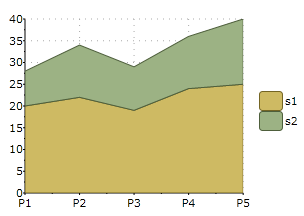
Area Stacked
The following image represents the Area Stacked chart when you set the ChartType property to AreaStacked:
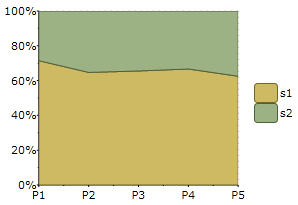
Area Stacked 100 Percent
The following image represents the Area Stacked 100 Percent chart when you set the ChartType property to AreaStacked100pc: