In some situations you may need to create custom axis annotation. The following scenarios can be useful for creating custom axis annotation:
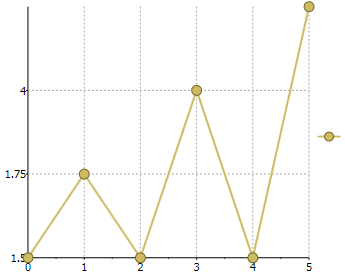
•When the ItemsSource property is a collection of numbers or DateTime values the chart uses these values as axis labels. The following code uses the ItemsSource property to create the custom Y-axis labels:
•C#
c1Chart1.Reset(true);
c1Chart1.Data.Children.Add(
new DataSeries() { ValuesSource = new double[] { 1, 2, 1, 3, 1, 4 } });
c1Chart1.ChartType = ChartType.LineSymbols;
c1Chart1.View.AxisY.ItemsSource = new double[] { 1.25, 1.5, 1.75, 4 };
Here is what the chart appears like after adding the preceding code:
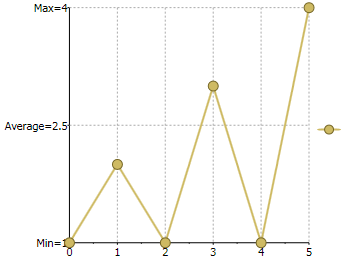
•When the ItemsSource property is a collection of KeyValuePair<object, double> or KeyValuePair<object, DateTime> the chart creates axis label based on the provided pairs of values. For example, the following code uses the KeyValuePair to create the custom axis annotation for the Y axis:
•C#
c1Chart1.Reset(true);
c1Chart1.Data.Children.Add(
new DataSeries() { ValuesSource = new double[] { 1, 2, 1, 3, 1, 4 } });
c1Chart1.ChartType = ChartType.LineSymbols;
c1Chart1.View.AxisY.ItemsSource = new List<KeyValuePair<object,double>>
{ new KeyValuePair<object,double>("Min=1", 1),
new KeyValuePair<object,double>("Average=2.5", 2.5),
new KeyValuePair<object,double>("Max=4", 4)};
Here is what the chart appears like after adding the preceding code:
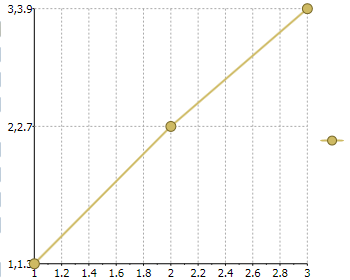
•You can use the ItemsValueBinding and ItemsLabelBinding properties to create axis labels using arbitrary collection as data source, like in the following code:
•C#
c1Chart1.Reset(true);
Point[] pts = new Point[] { new Point(1, 1.3), new Point(2, 2.7), new Point(3, 3.9) };
c1Chart1.DataContext = pts;
c1Chart1.ChartType = ChartType.LineSymbols;
c1Chart1.View.AxisY.ItemsSource = pts;
c1Chart1.View.AxisY.ItemsValueBinding = new Binding("Y");
c1Chart1.View.AxisY.ItemsLabelBinding = new Binding();
Here is what the chart appears like after adding the preceding code: