C1Chart implements Gantt charts, which show tasks organized along time.
Gantt charts use data series objects of type HighLowSeries. Each data series represents a single task, and each task has a set of start and end values. Simple tasks have one start value and one end value. Tasks that are composed of multiple sequential sub-tasks have multiple pairs of start and end values.
To demonstrate Gantt charts, let us start by defining a Task object:
•C#
class Task
{
public string Name { get; set; }
public DateTime Start { get; set; }
public DateTime End { get; set; }
public bool IsGroup { get; set; }
public Task(string name, DateTime start, DateTime end, bool isGroup)
{
Name = name;
Start = start;
End = end;
IsGroup = isGroup;
}
}
Next, let us define a method that creates a set of Task objects that will be shown as a Gantt chart:
•C#
Task[] GetTasks()
{
return new Task[]
{
new Task("Alpha", new DateTime(2008,1,1), new DateTime(2008,2,15), true),
new Task("Spec", new DateTime(2008,1,1), new DateTime(2008,1,15), false),
new Task("Prototype", new DateTime(2008,1,15), new DateTime(2008,1,31), false),
new Task("Document", new DateTime(2008,2,1), new DateTime(2008,2,10), false),
new Task("Test", new DateTime(2008,2,1), new DateTime(2008,2,12), false),
new Task("Setup", new DateTime(2008,2,12), new DateTime(2008,2,15), false),
new Task("Beta", new DateTime(2008,2,15), new DateTime(2008,3,15), true),
new Task("WebPage", new DateTime(2008,2,15), new DateTime(2008,2,28), false),
new Task("Save bugs", new DateTime(2008,2,28), new DateTime(2008,3,10), false),
new Task("Fix bugs", new DateTime(2008,3,1), new DateTime(2008,3,15), false),
new Task("Ship", new DateTime(2008,3,14), new DateTime(2008,3,15), false),
};
}
Now that the tasks have been created, we are ready to create the Gantt chart:
•C#
private void CreateGanttChart()
{
// Clear current chart
c1Chart1.Reset(true);
// Set chart type
c1Chart1.ChartType = ChartType.Gantt;
// Populate chart
var tasks = GetTasks();
foreach (var task in tasks)
{
// Create one series per task
var ds = new HighLowSeries();
ds.Label = task.Name;
ds.LowValuesSource = new DateTime[] { task.Start };
ds.HighValuesSource = new DateTime[] { task.End };
ds.SymbolSize = new Size(0, task.IsGroup ? 30 : 10);
// Add series to chart
c1Chart1.Data.Children.Add(ds);
}
// Show task names along Y axis
c1Chart1.Data.ItemNames =
(from task in tasks select task.Name).ToArray();
// Customize Y axis
var ax = c1Chart1.View.AxisY;
ax.Reversed = true;
ax.MajorGridStroke = null;
// Customize X axis
ax = c1Chart1.View.AxisX;
ax.MajorGridStrokeDashes = null;
ax.MajorGridFill = new SolidColorBrush(Color.FromArgb(20, 120, 120, 120));
ax.Min = new DateTime(2008, 1, 1).ToOADate();
}
After clearing the C1Chart and setting the chart type, the code enumerates the tasks and creates one HighLowSeries for each. In addition to setting the series Label, LowValuesSource and HighValuesSource properties, the code uses the SymbolSize property to set the height of each bar. In this sample, we define some tasks as "Group" tasks, and make them taller than regular tasks.
Next, we use a LINQ statement to extract the task names and assign them to the ItemNames property. This causes C1Chart to display the task names along the Y axis.
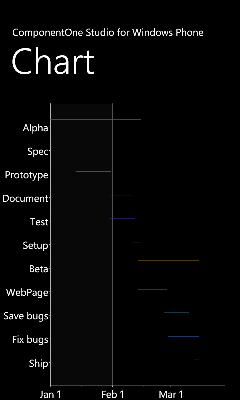
Finally, the code customizes the axes. The Y axis is reversed so the first task appears at the top of the chart. The axes are configured to show vertical grid lines and alternating bands.
The final result looks like this: