Axis Scrolling
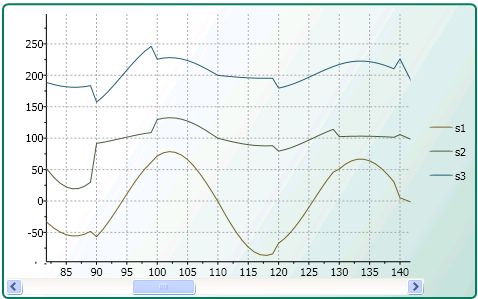
In circumstances when you have a substantial amount of X-values or Y-values in your chart data, you can add a scrollbar to the axes. Adding a scrollbar can make the data on the chart easier to read by scrolling through it so you can closely view pieces of data one at a time. The following image has the ScrollBar set to the View.AxisX.Value property.

A scrollbar can appear on the X-Axis or Y-Axis simply by setting the ScrollBar’s Value property to AxisX for the X-Axis or AxisY for the Y-Axis.
The following XAML code shows how to assign a horizontal scrollbar to the X-Axis:
<ScrollBar Name="sb" DockPanel.Dock="Bottom" Minimum="0" Maximum="1"
SmallChange="0.1" LargeChange="0.2" ViewportSize="0.2"
Orientation="Horizontal"
Value="{Binding ElementName=c1Chart1,Path=View.AxisX.Value}" />
Setting the Minimum and Maximum values for the Scrollbar will prevent the scrollbar from changing the Axis values when you are scrolling.