Creating a Gantt Chart
To create a Gantt chart, use the following XAML code:
<c1chart:C1Chart Margin="0"
Name="c1Chart1"
xmlns:sys="clr-namespace:System;assembly=mscorlib">
<c1chart:C1Chart.Resources>
<x:Array
x:Key="start" Type="sys:DateTime" >
<sys:DateTime>2008-6-1</sys:DateTime>
<sys:DateTime>2008-6-4</sys:DateTime>
<sys:DateTime>2008-6-2</sys:DateTime>
</x:Array>
<x:Array x:Key="end"
Type="sys:DateTime">
<sys:DateTime>2008-6-10</sys:DateTime>
<sys:DateTime>2008-6-12</sys:DateTime>
<sys:DateTime>2008-6-15</sys:DateTime>
</x:Array>
</c1chart:C1Chart.Resources>
<c1chart:C1Chart.Data>
<c1chart:ChartData>
<c1chart:ChartData.Renderer>
<c1chart:Renderer2D Inverted="True"
ColorScheme="Point"/>
</c1chart:ChartData.Renderer>
<c1chart:ChartData.ItemNames>Task1 Task2
Task3</c1chart:ChartData.ItemNames>
<c1chart:HighLowSeries HighValuesSource="{StaticResource
end}"
LowValuesSource="{StaticResource start}"/>
</c1chart:ChartData>
</c1chart:C1Chart.Data>
<c1chart:C1Chart.View>
<c1chart:ChartView>
<c1chart:ChartView.AxisX>
<c1chart:Axis IsTime="True"
AnnoFormat="d"/>
</c1chart:ChartView.AxisX>
</c1chart:ChartView>
</c1chart:C1Chart.View>
</c1chart:C1Chart>
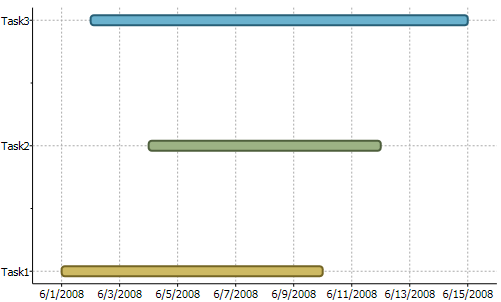
Run your project and the data in the XAML code produces the following Gantt chart in your Window: