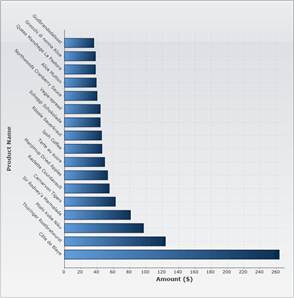
BuildProductPriceChart(
ChartType.Bar)
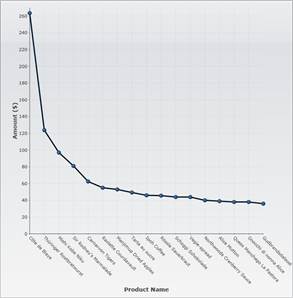
BuildProductPriceChart(
ChartType.LineSymbols)
Data-Binding to C1.Silverlight.Data
C1.Silverlight.Data is an assembly that contains a subset of the data objects in ADO.NET built for the Silverlight platform (DataSet, DataTable, DataView, and so on). It allows you to re-use your ADO.NET data and logic in Silverlight applications, and integrates with LINQ and modern data-binding mechanisms as shown below.
Creating charts from DataTable objects is easy. The first step is obtaining the data from the server. Loading a DataSet from a database or file is discussed in detail in the C1.Silverlight.Data documentation. The code below shows one easy way to load a DataSet from an XML file:
public Page()
{
InitializeComponent();
// Other initialization
// ...
// Go read NorthWind product data
WebClient wc = new WebClient();
wc.OpenReadCompleted += wc_OpenReadCompleted;
wc.OpenReadAsync(new Uri("products.xml", UriKind.Relative));
}
// Read NorthWind product data into data set
DataSet _dataSet = null;
void wc_OpenReadCompleted(object sender, OpenReadCompletedEventArgs e)
{
_dataSet = new DataSet();
_dataSet.ReadXml(e.Result);
}
The code uses a WebClient object to obtain an XML stream from the server. It assumes the "products.xml" file is present on the server and contains the NorthWind products table. The "products.xml" file was obtained by calling the DataSet.WriteXml method.
Once the data is available, creating the chart requires the same steps as before:
void BuildNorthWindChart(ChartType chartType)
{
// Clear current chart
_c1Chart.Reset(true);
// Set chart type
_c1Chart.ChartType = chartType;
// Get axes
Axis valueAxis = _c1Chart.View.AxisY;
Axis labelAxis = _c1Chart.View.AxisX;
if (chartType == ChartType.Bar)
{
valueAxis = _c1Chart.View.AxisX;
labelAxis = _c1Chart.View.AxisY;
}
// Configure label axis
labelAxis.Title = CreateTextBlock("Product Name", 14, FontWeights.Bold);
labelAxis.AutoMin = true;
labelAxis.AnnoAngle = 45;
// Configure value axis
valueAxis.Title = CreateTextBlock("Amount ($)", 14, FontWeights.Bold);
valueAxis.AutoMin = false;
valueAxis.Min = 0;
// Get the data
DataView dv = _dataSet.Tables["Products"].DefaultView;
dv.RowFilter = "UnitPrice >= 35";
dv.Sort = "UnitPrice DESC";
_c1Chart.Data.ItemsSource = dv;
// Show Product Name along x axis
_c1Chart.Data.ItemNameBinding = new Binding("ProductName");
// Add data series
var ds = new DataSeries();
ds.Label = "Unit Price";
ds.ValueBinding = new Binding("UnitPrice");
_c1Chart.Data.Children.Add(ds);
}
The new code gets the data by retrieving the default view for the products table. It then applies a filter to show only products with prices over $35 per unit, and sorts the products by unit price.
This is the result:
|
|
Alternatively, you could use LINQ to sort and filter the data in the DataTable:
// Get the data
//DataView dv = _dataSet.Tables["Products"].DefaultView;
//dv.RowFilter = "UnitPrice >= 35";
//dv.Sort = "UnitPrice DESC";
//_c1Chart.Data.ItemsSource = dv;
_c1Chart.Data.ItemsSource =
(
from dr
in _dataSet.Tables["Products"].Rows
where (decimal)dr["UnitPrice"] >= 35
orderby dr["UnitPrice"] descending
select dr.GetRowView()
).ToList();
The result is exactly the same as before. The difference between the two approaches is that the DataView object maintains a live connection to the underlying data. If the unit price of a product changed, the DataView would be automatically updated to reflect the new value and possibly filter the changed product in or out of view. The LINQ query, on the other hand, is converted into a static list and does not change.