Line Charts
Chart for Silverlight supports the following types of Line charts:
•Line
•LineSmoothed
•LineStacked
•LineStacked100pc
•LineSymbols
•LineSymbolsSmoothed
•LineSymbolsStacked
•LineSymbolsStacked100pc
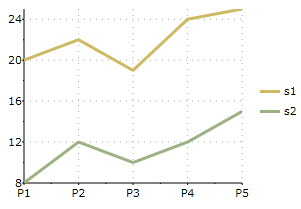
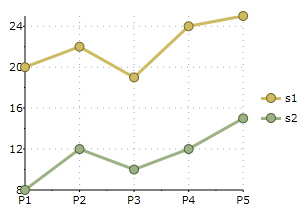
Line
The following image represents the Line chart when you set the ChartType property to Line:
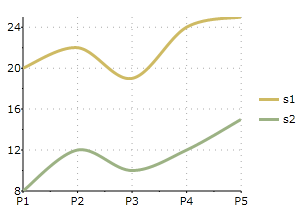
Line Smoothed
The following image represents the Line Smoothed chart when you set the ChartType property to LineSmoothed:
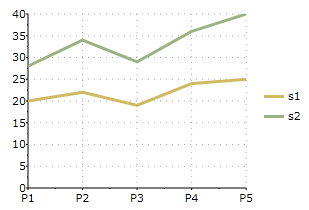
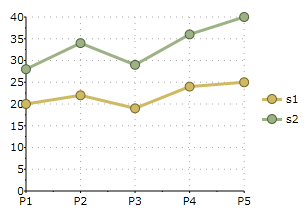
Line Stacked
Select the LineStacked member from the ChartType enumeration to create a specific stacking Line chart.. Stacking charts represent the data by stacking the values for each series on top of the values from the previous series.
The following image represents the Line Stacked chart when you set the ChartType property to LineStacked:
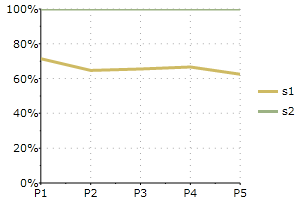
Line Stacked 100%
Select the LineStacked100pc member from the ChartType enumeration to create a specific stacking Line chart. Stacking charts represent the data by stacking the values for each series on top of the values from the previous series.
The following image represents the Line Stacked 100% chart when you set the ChartType property to LineStacked100pc:
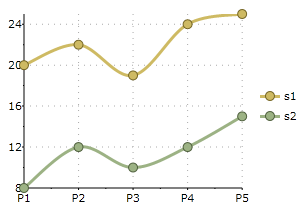
Line Symbols
The following image represents the Line Symbols when you set the ChartType property to LineSymbols:
Line Symbols Stacked
The following image represents the Line Symbols Stacked chart when you set the ChartType property to LineSymbolsStacked:
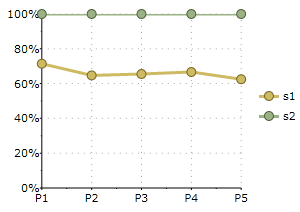
Line Symbols Stacked 100%
Select the LineSymbolsStacked100pc member from the ChartType enumeration to create a specific stacking Line chart. Stacking charts represent the data by stacking the values for each series on top of the values from the previous series.
The following image represents the Line Stacked 100% chart when you set the ChartType property to LineSymbolsStacked100pc:
Line Symbols Smoothed
The following image represents the Line Symbols Smoothed when you set the ChartType property to LineSymbolsSmoothed: