Pie Charts
Pie charts are commonly used to display simple values. They are visually appealing and often displayed with 3D effects such as shading and rotation.
Pie charts have one significant difference when compared to other C1Chart chart types in Pie charts; each series represents one slice of the pie. Therefore, you will never have Pie charts with a single series (they would be just circles). In most cases, Pie charts have multiple series (one per slice) with a single data point in each series. C1Chart represents series with multiple data points as multiple pies within the chart.
Chart for Silverlight supports the following types of Pie charts:
•Pie
•Dougnut Pie
•Exploded Pie
•Exploded Doughnut Pie
•PieStacked
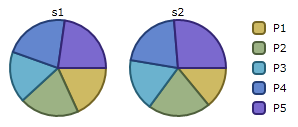
Pie
The following image represents the Pie chart when you set the ChartType property to Pie:
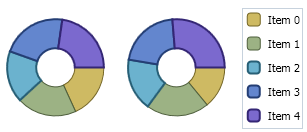
Doughnut Pie
The following image represents the Doughnut Pie chart when you set the ChartType property to PieDoughnut.
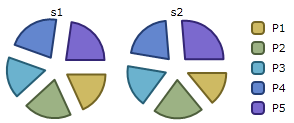
Exploded Pie
The following image represents the Exploded Pie chart when you set ChartType property to PieExploded:
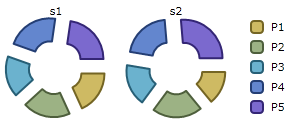
Exploded Doughnut Pie
The following image represents the Exploded Pie chart when you set ChartType property to PieExplodedDoughnut.
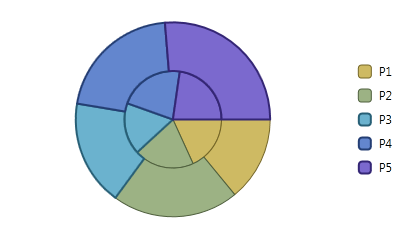
Pie Stacked
The following image represents the Pie Stacked chart when you set ChartType property to PieStacked.