Using XAML
In this document, we have created several charts using C# code. But you can also create charts entirely in XAML and using Blend or Visual Studio. The advantage of doing this is you can create charts interactively and see the effect of each change immediately.
To show how this works, open a project that contains a reference to the C1.Silverlight.Chart assembly and add new Silverlight user control named "XamlChart" to the project. Then open the XAML file in Visual Studio or Blend and copy or type the following content into it:
<UserControl x:Class="ChartIntro.XamlChart"
xmlns="http://schemas.microsoft.com/winfx/2006/xaml/presentation"
xmlns:x="http://schemas.microsoft.com/winfx/2006/xaml"
xmlns:c1chart="clr-namespace:C1.Silverlight.Chart;assembly=C1.Silverlight.Chart"
xmlns:c1="clr-namespace:C1.Silverlight;assembly=C1.Silverlight"
Width="400" Height="300">
<Grid x:Name="LayoutRoot" Background="White">
<!-- Create chart, specify type -->
<c1chart:C1Chart x:Name="chart0" ChartType="Bar" >
<!-- Populate the chart with two series -->
<c1chart:C1Chart.Data>
<c1chart:ChartData ItemNames="cat1 cat2 cat3 cat4" >
<c1chart:DataSeries Label="s1" Values="1 2 3 4" SymbolFill="Azure" />
<c1chart:DataSeries Label="s2" Values="3 2 3 1" SymbolFill="Crimson" />
</c1chart:ChartData>
</c1chart:C1Chart.Data>
<!-- Configure axes -->
<c1chart:C1Chart.View>
<c1chart:ChartView>
<c1chart:ChartView.AxisX>
<c1chart:Axis Min="-1" Max="5" AnnoFormat="c" AnnoAngle="45" MajorUnit="1"/>
</c1chart:ChartView.AxisX>
<c1chart:ChartView.AxisY>
<c1chart:Axis Reversed="True"/>
</c1chart:ChartView.AxisY>
</c1chart:ChartView>
</c1chart:C1Chart.View>
</c1chart:C1Chart>
<!-- Add a legend -->
<c1chart:C1ChartLegend />
</Grid>
</UserControl>
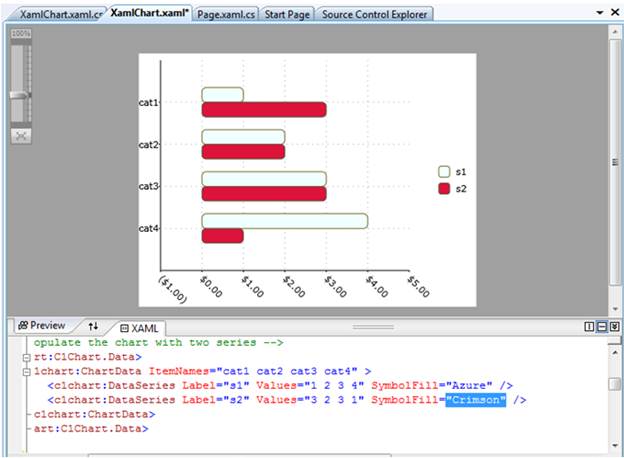
If you edit this code in Visual Studio's split window, you will be able to see the effect of each change you make as you type it. This makes it easy to experiment with different settings to get the results you want.
Notice that you can edit most chart elements directly in XAML, including the data series and the axes.
The image below shows the interactive editing process within Visual Studio:

This is a convenient way to get the chart set up. At run time, you would use code to provide the actual chart data by setting the ItemNames and ValuesSource property on each data series as we did in earlier examples. For example:
public XamlChart()
{
// Initialize control
InitializeComponent();
// Set item names and series values
chart0.Data.ItemNames = GetItemNames(10);
foreach (DataSeries ds in chart0.Data.Children)
{
ds.ValuesSource = GetSeriesData(10);
}
}
string[] GetItemNames(int count)
{
string[] names = new string[count];
for (int i = 0; i < count; i++)
{
names[i] = string.Format("item {0}", i);
}
return names;
}
Random _rnd = new Random();
double[] GetSeriesData(int count)
{
double[] values = new double[count];
for (int i = 0; i < count; i++)
{
values[i] = _rnd.Next(0, 5);
}
return values;
}
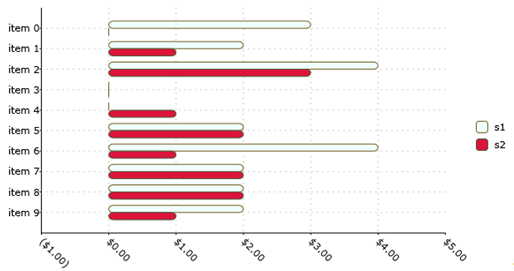
The code replaces the dummy data we used at design time the actual data. The final result is shown below:
