Bubble Charts
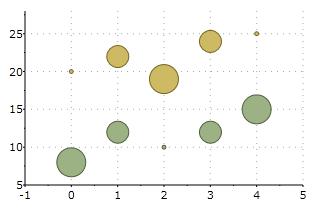
The following image represents the Bubble chart when you set ChartType property to Bubble:
The following XAML code creates a Bubble chart:
<c1chart:C1Chart Height="200" Width="300" ChartType="Bubble" Margin="56,45,284,235" c1chart:BubbleOptions.MinSize="5,5"
c1chart:BubbleOptions.MaxSize="30,30"
c1chart:BubbleOptions.Scale="Area">
<c1chart:C1Chart.Data>
<c1chart:ChartData>
<c1chart:BubbleSeries Values="20 22 19 24 25" SizeValues="1 2 3 2 1" />
<c1chart:BubbleSeries Values="8 12 10 12 15" SizeValues="3 2 1 2 3"/>
</c1chart:ChartData>
</c1chart:C1Chart.Data>
</c1chart:C1Chart>