Polar and Radar Charts
Polar Charts
A Polar chart draws the x and y coordinates in each series as (theta,r), where theta is amount of rotation from the origin and r is the distance from the origin. Theta may be specified in either degrees (default) or radians. Since the X-axis is a circle, the X-axis maximum and minimum values are fixed.
Polar charts can not be combined with any other chart type in the same chart area.
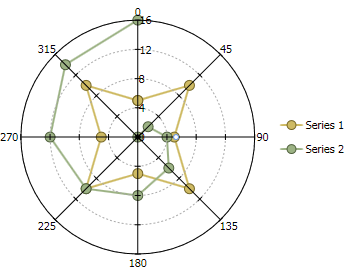
The following images represents the different types of Polar charts when you set ChartType property to PolarLinesSymbol, PolarLines, PolarSymbols and specifiy the data values for the XYDataSeries, like the following:
<c1chart:C1Chart Name="c1Chart1" ChartType="PolarLinesSymbols">
<c1chart:C1Chart.Data>
<c1chart:ChartData>
<c1chart:XYDataSeries Label="Series 1" Values="5 10 5 10 5 10 5 10 5"
XValues="0 45 90 135 180 225 270 315 0"/>
<c1chart:XYDataSeries Label="Series 2" Values="0 2 4 6 8 10 12 14 16"
XValues="0 45 90 135 180 225 270 315 0"/>
</c1chart:ChartData>
</c1chart:C1Chart.Data>
<c1chart:C1ChartLegend/> </c1chart:C1Chart>
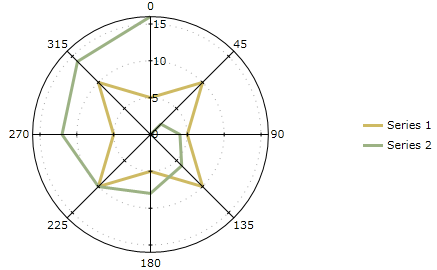
The following image represents the Polar chart with symbols and lines when you set ChartType property to PolarLines.
<c1chart:C1Chart Name="c1Chart1" ChartType="PolarLines">
<c1chart:C1Chart.Data>
<c1chart:ChartData>
<c1chart:XYDataSeries Label="Series 1" Values="5 10 5 10 5 10 5 10 5"
XValues="0 45 90 135 180 225 270 315 0"/>
<c1chart:XYDataSeries Label="Series 2" Values="0 2 4 6 8 10 12 14 16"
XValues="0 45 90 135 180 225 270 315 0"/>
</c1chart:ChartData>
</c1chart:C1Chart.Data>
<c1chart:C1ChartLegend/> </c1chart:C1Chart>
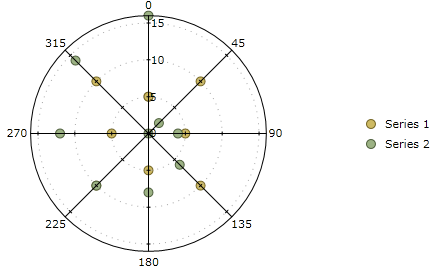
The following image represents the Polar chart when you set ChartType property to PolarSymbols.
<c1chart:C1Chart Name="c1Chart1" ChartType="PolarSymbols">
<c1chart:C1Chart.Data>
<c1chart:ChartData>
<c1chart:XYDataSeries Label="Series 1" Values="5 10 5 10 5 10 5 10 5"
XValues="0 45 90 135 180 225 270 315 0"/>
<c1chart:XYDataSeries Label="Series 2" Values="0 2 4 6 8 10 12 14 16"
XValues="0 45 90 135 180 225 270 315 0"/>
</c1chart:ChartData>
</c1chart:C1Chart.Data>
<c1chart:C1ChartLegend/> </c1chart:C1Chart>
Radar Charts
A Radar chart is a variation of a Polar chart. A Radar chart draws the y value in each data set along a radar line. If the data has n unique points, then the chart plane is divided into n equal angle segments, and a radar line is drawn (representing each point) at n/360 degree increments. By default, the radar line representing the first point is drawn vertically (at 90 degrees).
The labels for radar chart can be set using ItemNames property. These labels are located at end of each radial line.
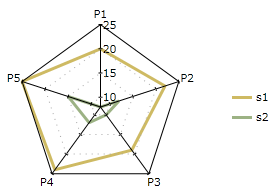
The following image represents the Radar chart when you set ChartType property to Radar.
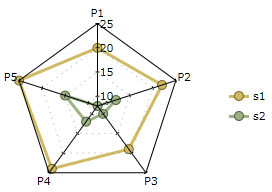
The following image represents the Radar chart with symbols when you set ChartType property to RadarSymbols.
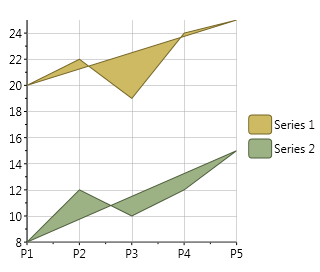
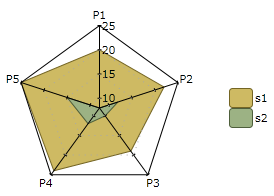
The following image represents the filled Radar chart when you set ChartType property to RadarFilled.
Special Polar and Radar Chart Properties
The Polar and Radar charts has special properties to chart the degrees of the Radar, set the starting angle, create filled radar chart.and whether or not to use flat Y coordinate gridlines for radar charts.
Setting the Starting Angle
The PolarRadarOptions.StartingAngle Attached property of the PolarRadarOptions class sets the starting angle for Polar and Radar charts. The default setting for this property is 0. Setting this property to a value other than 0 will move the origin of the chart counter-clockwise by the specified degrees. For instance, setting the PolarRadarOptions.StartingAngle Attached property to 90, the Polar or Radar chart rotates 90 degrees in the counter-clockwise direction.
Controlling Appearance of Labels on the Axes
You can use the RadarLabelVisibility to control the appearance of the labels on the axes of radar chart. There are three available options that specify in the corresponding enumeration:
•RadarLabelVisibility.First - The annotation labels appears only on the first radial axis(default).
•RadarLabelVisibility.All - The annotation labels appears only on each radial axis(default).
•RadarLabelVisibility.None - No labels. The property has effect only on radar chart.
•Polygon Charts
The following image represents the Polygon chart when you set ChartType property to Polygon:
The following image represents the Polygon Filled chart when you set ChartType property to PolygonFilled:
•