 What You’ve
Accomplished
What You’ve
AccomplishedStep 2 of 4: Adding Data to the Chart
In the last step, you added the C1Chart control to the Window. In this step, you will add a DataSeries object and data for it.
To add data to the chart programmatically in the code behind file
1. Right-click on the MainPage.xaml file and select View Code to open the editor.
2. Add the C1.Silverlight.C1Chart namespace directive
Imports C1.Silverlight.Chart
•C#
using C1.Silverlight.Chart;
3. Add the following code in the constructor Window1 class to create the Bar chart:
' Clear previous data
c1Chart1.Data.Children.Clear()
' Add Data
Dim ProductNames As String() = {"Hand Mixer", "Stand Mixer", "Can Opener", "Toaster", "Blender", "Food Processor", _
"Slow Cooker", "Microwave"}
Dim PriceX As Integer() = {80, 400, 20, 60, 150, 300, _
130, 500}
' create single series for product price
Dim ds1 As New DataSeries()
ds1.Label = "Price X"
'set price data
ds1.ValuesSource = PriceX
' add series to the chart
c1Chart1.Data.Children.Add(ds1)
' add item names
c1Chart1.Data.ItemNames = ProductNames
' Set chart type
c1Chart1.ChartType = ChartType.Bar
•C#
// Clear previous data
c1Chart1.Data.Children.Clear();
// Add Data
string[] ProductNames = { "Hand Mixer", "Stand Mixer", "Can Opener", "Toaster", "Blender", "Food Processor", "Slow Cooker", "Microwave" };
int[] PriceX = { 80, 400, 20, 60, 150, 300, 130, 500 };
// create single series for product price
DataSeries ds1 = new DataSeries();
ds1.Label = "Price X";
//set price data
ds1.ValuesSource = PriceX;
// add series to the chart
c1Chart1.Data.Children.Add(ds1);
// add item names
c1Chart1.Data.ItemNames = ProductNames;
// Set chart type
c1Chart1.ChartType = ChartType.Bar;
In the next step, Step 3 of 4: Format the Axes, you’ll learn how to customize the axes programmatically
What You’ve
Accomplished
You have successfully added data to C1Chart so when you run your application the string values appear on the Y-axis like the following:
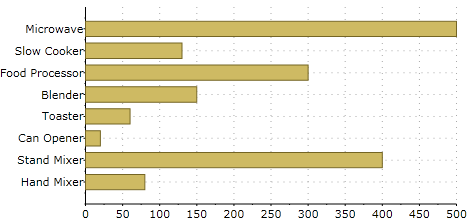
In the next step you will add a ChartView object so you can customize the X-Axis.