 What You’ve
Accomplished
What You’ve
AccomplishedStep 4 of 4: Adjust the Chart’s Appearance
In this last step, you will adjust the chart’s appearance using the Theme property and the Palette property.
To set chart’s theme and palette programmatically in the code behind file
To specifically define the Office2007Blue theme in your chart, add the following code your project:
c1Chart1.Palette = Palette.Module;
c1Chart1.Theme = ChartTheme.Office2007Blue;
•C#
c1Chart1.Palette = Palette.Module;
c1Chart1.Theme = ChartTheme.Office2007Blue;
What You’ve
Accomplished
You successfully applied the Office 2007 Blue theme and the Module to the C1Chart control. When you run your application it appears like the following:
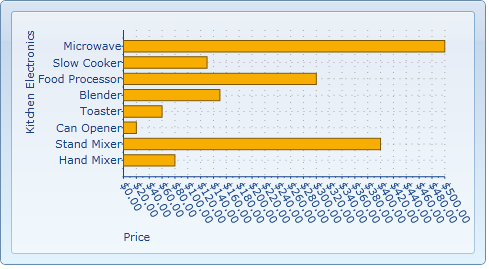
Congratulations! You've completed the Chart for Silverlight quick start and created a chart application, added data to the chart, set the axes bounds, formatted the axes annotation, and customized the appearance of the chart.