XYPlot Chart
The XYPlot is also known as a Scatter plot chart. For more information on the XYPlot chart see XY Charts.
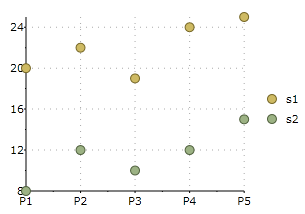
The following image represents the XYPlot chart when you set ChartType property to XYPlot: