ErrorBar chart enables user to spot margins of error and standard deviations at a glance. It can be shown as a standard error amount, a percentage, or a standard deviation. User can also set its own custom values to display the exact error amounts in the Chart. Generally, results of scientific studies or experimental sciences use error bars in charts to depict variations in data from original values.
This topic describes how to use ErrorBar series in your FlexChart to represent error and standard deviations. To work with ErrorBar Series, you need to create an instance of FlexChart class, which is a part of C1.Web.Mvc namespace.
- Step 1: Create a Datasource for FlexChart
- Step 2: Add ErrorBar Series to FlexChart
- Step 3: Build and Run the Project
The following image shows how FlexChart appears after completing the above steps: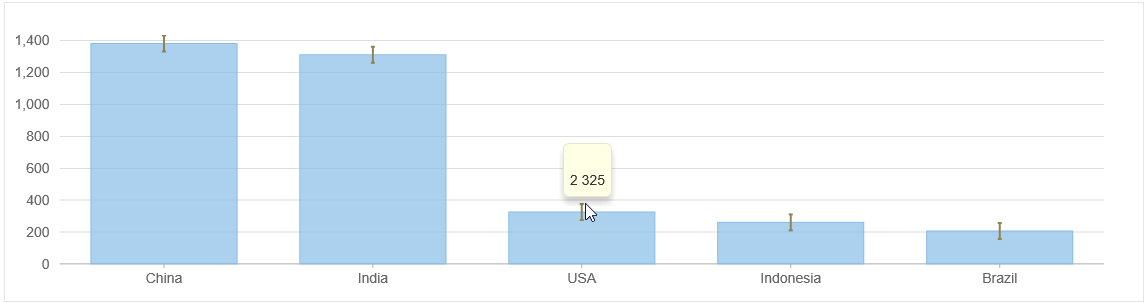
Step 1: Create a Datasource for FlexChart
- Add a new class to the Models folder (for example:
PopulationByCountry.cs). - Add the following code to the new model to define a class which will serve as a datasource for the FlexChart.
PopulationByCountry.cs Copy Codeusing System.Collections.Generic; namespace ErrorBarSeries.Models { public class PopulationByCountry { public string Country { get; set; } public int Population { get; set; } public static List<PopulationByCountry> GetData() { string[] countries = "China,India,USA,Indonesia,Brazil".Split(new char[] { ',' }); int[] population = new int[] { 1380, 1310, 325, 260, 206 }; var data = new List<PopulationByCountry>(); for (var i = 0; i < countries.Length; i++) { data.Add(new PopulationByCountry() { Country = countries[i], Population = population[i] }); } return data; } } }
Step 2: Add ErrorBar Series to FlexChart
To add a FlexChart to the application, follow these steps:
Add a new Controller
- In the Solution Explorer, right click the folder Controllers.
- From the context menu, select Add | Controller. The Add Scaffold dialog appears.
- In the Add Scaffold dialog, follow these steps:
- Select Empty MVC Controller template.
- Set name of the controller (for example:
ErrorBarController). - Click Add.
- Include the MVC references as shown below.
C# Copy Codeusing C1.Web.Mvc; using C1.Web.Mvc.Serializition; using C1.Web.Mvc.Chart;
- Replace the method Index() with the following method.
C# Copy Codepublic ActionResult Index() { return View(PopulationByCountry.GetData()); }
Add a View for the Controller
- From the Solution Explorer, expand the folder Controllers and double click the
ErrorBarController. - Place the cursor inside the method
Index(). - Right click and select Add View. The Add View dialog appears.
- In the Add View dialog, verify that the view name is Index and View engine is Razor (CSHTML).
- Click Add. A view is added for the controller.
Index.cshtml Copy Code@model IEnumerable<PopulationByCountry> @using ErrorBarSeries.Models; <br /> <br /> @(Html.C1().FlexChart() .Bind("Country", "Population", Model) .Series(ser => { ser.AddErrorBar().Value(50) .ErrorBarStyle(errorBarStyle => errorBarStyle.Fill("#e6e6e6").Stroke("#918254").StrokeWidth(2)); }) .Height("300px") )
Index.cshtml Copy Code@model IEnumerable<PopulationByCountry> @using ErrorBarSeries.Models; @{ var errorBarStyle = new SVGStyle { Fill = "#e6e6e6", Stroke = "#918254", StrokeWidth = 2 }; } <c1-flex-chart binding="Population" binding-x="Country" height="300px"> <c1-items-source source-collection="Model" /> <c1-flex-chart-error-bar name="Population" value="50" error-bar-style="@errorBarStyle" /> </c1-flex-chart>
Step 3: Build and Run the Project
- Click Build | Build Solution to build the project.
- Press F5 to run the project.

Append the folder name and view name to the generated URL (for example: http://localhost:1234/ErrorBar/Index) in the address bar of the browser to see the view.