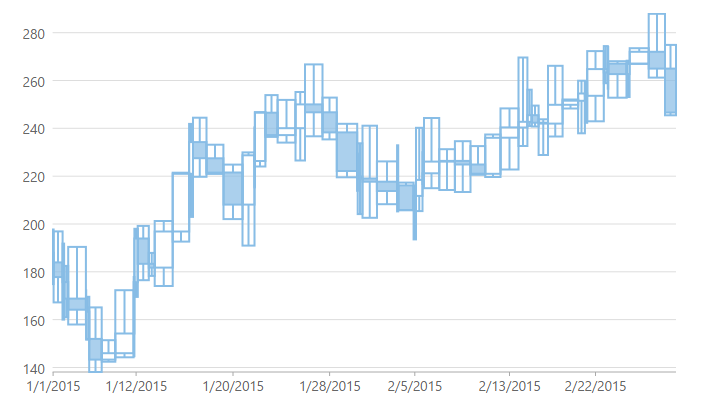
ComponentOne's MVC Edition offers Financial Charts, the newest range of charts that lets you create advanced, stock trending visualizations. Use these charts to analyze data trends with trend lines, filters, range selectors, and annotations with minimal coding. With various built-in features and different chart types, FinancialChart control itself is optimized and targeted for the finance industry.

Key Features
- Chart Type: Change a line chart to a bar chart or any other chart type by setting a single property. Provides fifteen different chart types to choose from.
- Multiple Areas: Allows you to add multiple series and areas on a single chart without data overlapping.
- Markers: Displays a text area on the FinancialChart.
- Range Selector: Adjusts the FinancialChart's visible range of data at runtime.
- Trend Lines: Visualizes trends in data and analyze the problems of prediction.
- Tooltips: Display chart values using tooltips.
- Header and Footer: Use simple properties to set a title and footer text.
- Legend: Change position of the legend as needed.
- Annotations: Mark important events or news attached to a specific data point on financial charts.
- Fibonacci Series: Calculate and mark various alert trends on financial charts for stock analysis.
- Moving Average: Analyze data points through a series of averages of different subsets of entire data set.
- Function Series: Create analytical financial charts using different formulae for calculating y.
- Parametric Series: Create analytical financial charts using different formulae for calculating x and y.
- Hit Test: Determine coordinates and index of points hovered on chart.
- Indicators: Analyze and predict trends in price and volume momentum of trading instruments.