After designing the basic layout, you may decide that grouping the records by certain fields or other criteria would make the report easier to read. Grouping allows you to separate groups of records visually and display introductory and summary data for each group. The group break is based on a grouping expression. This expression is usually based on one or more recordset fields but it can be as complex as you like.
You can group the data in your reports using the C1ReportDesigner application or using code:
•
Adding grouping and sorting using
C1ReportDesigner ![]()
Groups are also used for sorting the data, even if you don't plan to show the Group Header and Footer sections. You can add groups to your report using the C1ReportDesigner application.

To add or edit the groups in the report, complete the following steps:
1. Open the C1ReportDesigner application. For details, see Accessing C1ReportDesigner from Visual Studio.
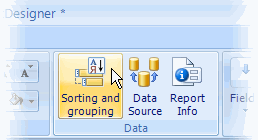
2. Click the Sorting and Grouping button on the Design tab in the Data group.
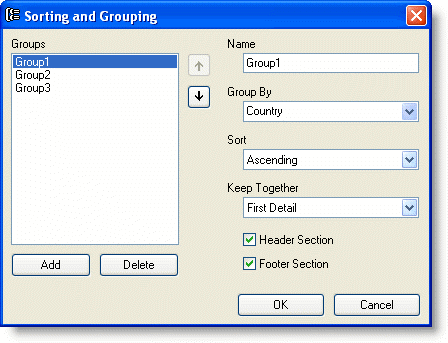
The Sorting and Grouping dialog box appears. You can use this dialog box to create, edit, reorder, and delete groups.
3. To create a group, click the Add button and set the properties for the new group.
The Group By field defines how the records will be grouped in the report. For simple grouping, you can select fields directly from the drop-down list. For more complex grouping, you can type grouping expressions. For example, you could use Country to group by country or Left(Country, 1) to group by country initial.
4. To follow along with this report, select Country for the Group By expression.
5. Next, select the type of sorting you want (Ascending in this example). You can also specify whether the new group will have visible Header and Footer sections, and whether the group should be rendered together on a page.
Note: You cannot use memo or binary (object) fields for grouping and sorting. This is a limitation imposed by OLEDB.
Here's what the Sorting and Grouping dialog box should look like at this point:

If you add more fields, you can change their order using the arrow buttons on the right of the Groups list. This automatically adjusts the position of the Group Header and Footer sections in the report. To delete a field, use the Delete button.
Once you are done arranging the fields, click OK to dismiss the dialog box and see the changes in the Designer. There are two new sections, a Header and Footer for the new group. Both have height zero at this point, you can expand them by dragging the edges with the mouse. Notice that the Group Header section is visible, and the footer is not. This is because the Group Header button in the dialog box has been checked, and the Group Footer button was left unchecked. Invisible sections are displayed with a hatch pattern to indicate they are invisible.

On the tan bars that mark the top of the new sections there are labels that contain the section name and the value of the group's GroupBy property.
To see how groups work, click the Add Data Field
button ![]() ,
select Country from the menu and mark an area in the newly created Group
Header Section. Click the new field to select it and change its Font
property to make the new field stand out a little.
,
select Country from the menu and mark an area in the newly created Group
Header Section. Click the new field to select it and change its Font
property to make the new field stand out a little.
•
Adding grouping and sorting using code ![]()
Useful reports don't simply show data, they show it in an organized manner. C1Report uses groups to group and sort data. To demonstrate how this works, return to the Creating a Report Definition topic's code and group the employees by country.
The following code creates a group object that sorts and groups records by country:
If chkGroup.Checked Then
' group employees by country, in ascending order
Dim grp As Group
grp = c1r.Groups.Add("GrpCountry", "Country", SortEnum.Ascending)
' format the Header section for the new group
With grp.SectionHeader
.Height = 500
.Visible = True
f = .Fields.Add("CtlCountry", "Country", 0, 0, c1r.Layout.Width, 500)
f.Calculated = True
f.Align = FieldAlignEnum.LeftMiddle
f.Font.Bold = True
f.Font.Size = 12
f.BorderStyle = BorderStyleEnum.Solid
f.BorderColor = Color.FromArgb(0, 0, 150)
f.BackStyle = BackStyleEnum.Opaque
f.BackColor = Color.FromArgb(150, 150, 220)
f.MarginLeft = 100
End With
' sort employees by first name within each country
c1r.Groups.Add("GrpName", "FirstName", SortEnum.Ascending)
End If
• C#
if (chkGroup.Checked)
{
// group employees by country, in ascending order
Group grp = c1r.Groups.Add("GrpCountry", "Country", SortEnum.Ascending);
// format the Header section for the new group
s = grp.SectionHeader;
s.Height = 500;
s.Visible = true;
f = s.Fields.Add("CtlCountry", "Country", 0, 0, c1r.Layout.Width, 500);
f.Calculated = true;
f.Align = FieldAlignEnum.LeftMiddle;
f.Font.Bold = true;
f.Font.Size = 12;
f.BorderStyle = BorderStyleEnum.Solid;
f.BorderColor = Color.FromArgb(0, 0, 150);
//f.BackStyle = BackStyleEnum.Opaque;
f.BackColor = Color.Transparent;
f.BackColor = Color.FromArgb(150, 150, 220);
f.MarginLeft = 100;
// sort employees by first name within each country
c1r.Groups.Add("GrpName", "FirstName", SortEnum.Ascending);
}
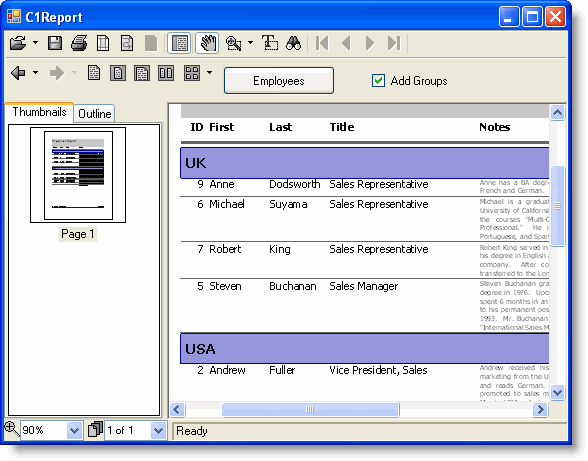
Every group has Header and Footer sections. These are invisible by default, but the code above makes the Header section visible to show which country defines the group. Then it adds a field with the country. The new field has a solid background color.
Finally, the code adds a second group to sort the employees within each country by their first name. This group is only used for sorting, so the Header and Footer sections remain invisible.
The changes are now complete. To render the new report, you need to finish the routine with a call to the Render method. Enter the following code in the btnEmployees_Click event handler:
' render the report into the PrintPreviewControl
ppv.Document = c1r.Document
• C#
// render the report into the PrintPreviewControl
ppv.Document = c1r.Document;
Here's an example of a report using a group object:

|
