When defining a ChartLabel, it is necessary to specify how to attach it to the chart and where to position it relative to its attachment point.
The attachment method chosen depends on what the ChartLabel is going to be used for. The attachment method takes an AttachMethodEnum value with four possible values: Coordinate, DataCoordinate, DataIndex, and DataIndexY.
ChartLabels can be attached to a chart in one of four ways:
•To a pixel (x,y) coordinate
•To a data (x,y) coordinate in the ChartArea
•To a (series, point) in the ChartArea
•To a (series, point, Y value) in the ChartArea
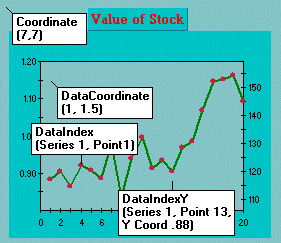
The following image illustrates the ChartLabel attachment methods:

The following list explains each attachment method for the ChartLabels:
•AttachMethodEnum.Coordinate attaches the label anywhere on the chart. The number of pixels can be specified between the top-left corners of the chart to the ChartLabel.
•AttachMethodEnum.DataCoordinate attaches the label anywhere inside the PlotArea. The data coordinates can be specified. This method is not allowed on Pie charts using PointLabels for the X-axis annotation. If any part of the ChartLabel falls outside of the ChartArea, it is clipped.
•AttachMethodEnum.DataIndex attaches the label to a specific data point on the chart. The series and point indices, and the ChartGroup can be specified.
•AttachMethodEnum.DataIndexY attaches the label to a distance above or below a specific data point. The series and point indices, the ChartGroup, and the Y-coordinate can be specified. This is most useful for Bar and Stacking Bar charts.
Use the AttachMethod property of the Label class to set the attachment method, and the properties of the AttachMethodData class to set the attachment point. These properties can be accessed programmatically through the Label class or at design time through the Labels Collection editor or the Edit Labels designer. For more information on setting the ChartLabel methods at design time using Chart's Smart Designer, see Attaching and Positioning Chart Labels.