Although not as common, it is possible to use a single chart to show series that are measured using different scales and units. For example, you could show product prices and inventory levels on a single chart. To do this, you need to use a second Y-axis. The primary axis would show prices (in currency units) and the secondary axis would show counts.
To plot data against the secondary Y-axis, add new series to the second chart group (remember every C1Chart has two chart groups). You can use a different data type for the second chart group in order to make the chart clearer.
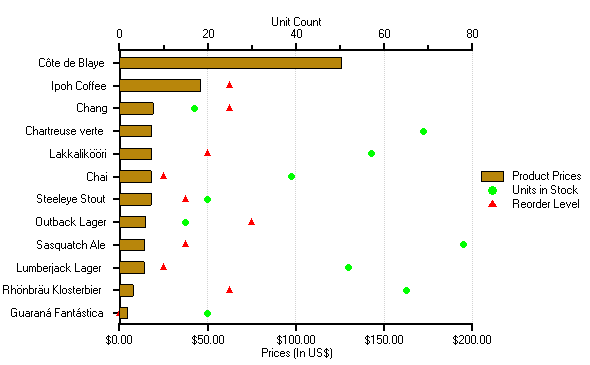
For example, the following chart contains three series. The first shows product unit prices (as bars, plotted against the primary Y-axis), and the others show the number of units in stock and the reorder level (as symbols, plotted against the secondary Y-axis).
The code used to create this second chart starts with the exact same steps used to create the previous chart. The two additional series, Units in Stock and Reorder Level, are created using the following code.
' label Y-axis and show legend
C1Chart1.Legend.Visible = True
C1Chart1.ChartArea.AxisY.Text = "Prices (in US$)"
C1Chart1.ChartArea.AxisY2.Text = "Unit Count"
' create two series for units in stock and reorder level
' (these are plotted against the secondary Y axis)
dscoll = C1Chart1.ChartGroups(1).ChartData.SeriesList
dscoll.Clear()
' units in stock
series = dscoll.AddNewSeries()
series.Label = "Units In Stock"
series.SymbolStyle.Color = Color.Green
series.LineStyle.Pattern = LinePatternEnum.None
series.PointData.Length = data.Count
For i = 0 To data.Count – 1
series.X(i) = I
series.Y(i) = data(i)("UnitsInStock")
Next I
' reorder level
series = dscoll.AddNewSeries()
series.Label = "Reorder Level"
series.SymbolStyle.Color = Color.Red
series.LineStyle.Pattern = LinePatternEnum.None
series.PointData.Length = data.Count
For i = 0 To data.Count – 1
series.X(i) = I
series.Y(i) = data(i)("ReorderLevel")
Next I
' show gridlines for secondary Y-axis
C1Chart1.ChartArea.AxisY2.GridMajor.Visible = True
•C#
// label Y-axis and show legend
_c1c.Legend.Visible = true;
_c1c.ChartArea.AxisY.Text = "Prices (in US$)";
_c1c.ChartArea.AxisY2.Text = "Unit Count";
// create two series for units in stock and reorder level
// (these are plotted against the secondary Y axis)
dscoll = _c1c.ChartGroups[1].ChartData.SeriesList;
dscoll.Clear();
// units in stock
series = dscoll.AddNewSeries();
series.Label = "Units In Stock";
series.SymbolStyle.Color = Color.Green;
series.LineStyle.Pattern = LinePatternEnum.None;
series.PointData.Length = data.Count;
for (int i = 0; i < data.Count; i++)
{
series.X[i] = i;
series.Y[i] = data[i]["UnitsInStock"];
}
// reorder level
series = dscoll.AddNewSeries();
series.Label = "Reorder Level";
series.SymbolStyle.Color = Color.Red;
series.LineStyle.Pattern = LinePatternEnum.None;
series.PointData.Length = data.Count;
for (int i = 0; i < data.Count; i++)
{
series.X[i] = i;
series.Y[i] = data[i]["ReorderLevel"];
}
// show gridlines for secondary Y-axis
_c1c.ChartArea.AxisY2.GridMajor.Visible = true;