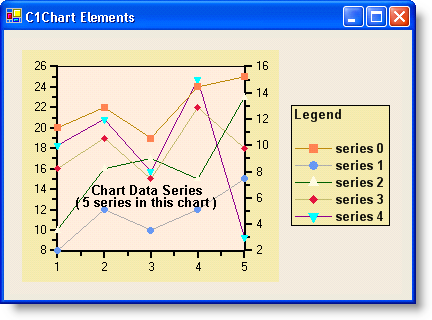
The following illustration shows five Chart Data Series on C1Chart:
From a developer's perspective, this is one of the most important properties in C1Chart. All other properties can be set at design time using the Chart Wizard, Chart Properties designer, or loaded from predefined chart layout files. In most cases, however, the data being plotted is added using code, and to do that you need to use the SeriesList property.
The SeriesList property returns a ChartDataSeriesCollection object that allows you to add and remove series from the chart, and to retrieve individual series. For an example that shows how to programmatically add data series see, Adding Data Series.
The ChartDataSeries objects have the following main properties:
Property | Description |
Determines whether the series is visible and how missing values ("data holes") should be displayed. | |
Contains the text that is displayed in the legend (if LegendEntry is set to True). | |
Determines whether the series Label should be displayed in the legend. | |
Contains properties that determine the color, thickness, and pattern used to display the series (the color is used for lines, areas, bars, and pie slices). For more informatio see Line and Symbol Styles for the Series. | |
Contains properties that determine the shape, size, and color of the symbols used to mark the data points in the series. For more information see Line and Symbol Styles for the Series. | |
Returns a ChartDataArray object used to get or set the X, Y coordinates of each data point in the series. | |
Return ChartDataArray objects used to get or set individual coordinates of each data point in the series. Some chart types have additional data arrays (for example, "HiLoOpenClose" also has Y1, Y2, and Y3). |
The PointData, X, and Y properties allow you to set and retrieve the data used to display each individual series.
Most chart types require you to provide X and Y values for each point. The exceptions are pie charts (which do not require X values) and specialized charts such as Bubble, HiLo, Gantt, and HiLoClose, which require additional Y values.